Menominee vs Panamanian 3rd Grade
COMPARE
Menominee
Panamanian
3rd Grade
3rd Grade Comparison
Menominee
Panamanians
98.0%
3RD GRADE
95.4/ 100
METRIC RATING
114th/ 347
METRIC RANK
97.7%
3RD GRADE
31.5/ 100
METRIC RATING
190th/ 347
METRIC RANK
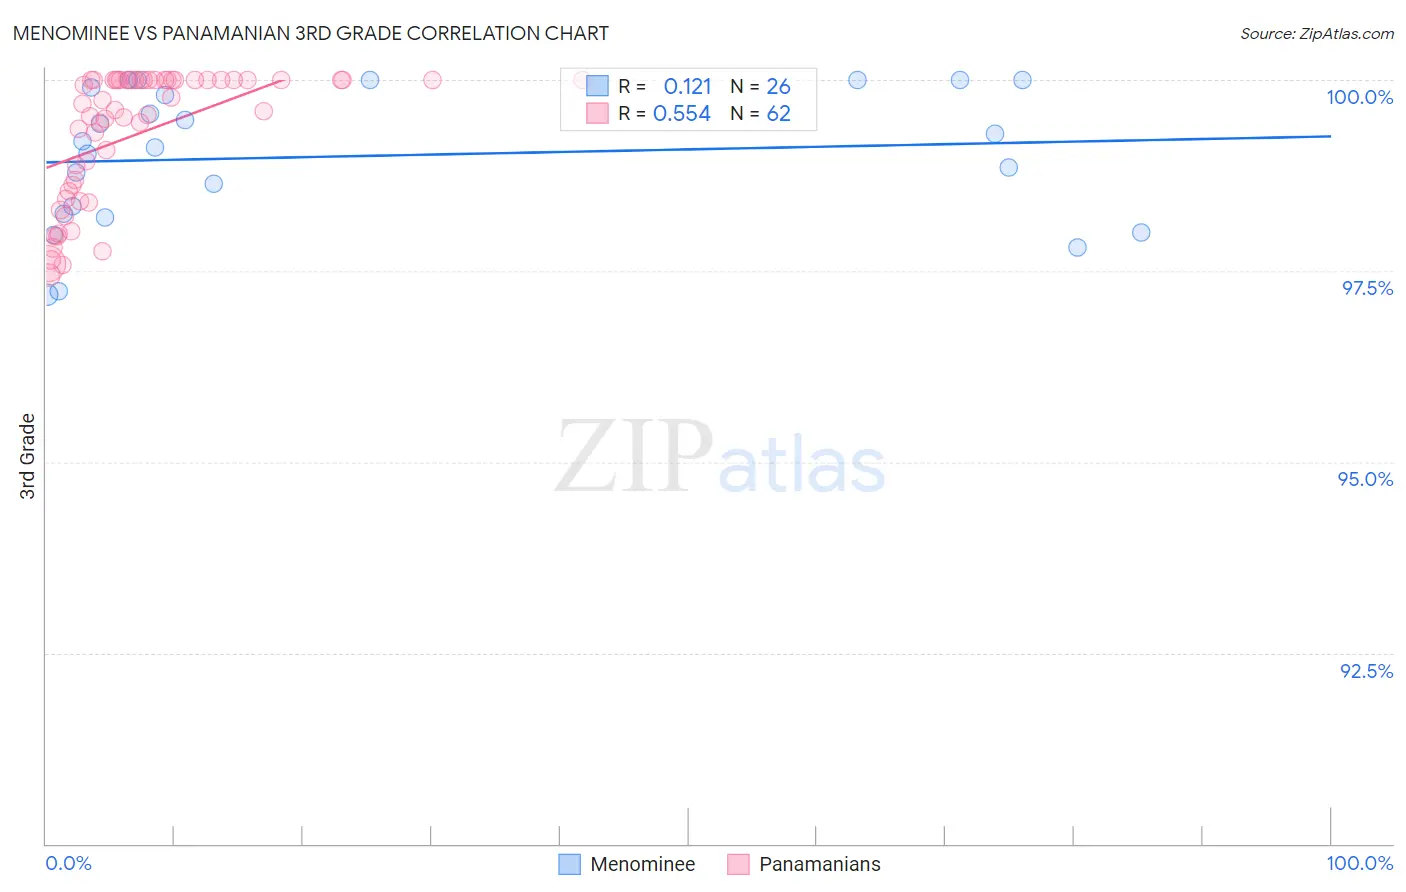
Menominee vs Panamanian 3rd Grade Correlation Chart
The statistical analysis conducted on geographies consisting of 45,778,979 people shows a poor positive correlation between the proportion of Menominee and percentage of population with at least 3rd grade education in the United States with a correlation coefficient (R) of 0.121 and weighted average of 98.0%. Similarly, the statistical analysis conducted on geographies consisting of 281,248,945 people shows a substantial positive correlation between the proportion of Panamanians and percentage of population with at least 3rd grade education in the United States with a correlation coefficient (R) of 0.554 and weighted average of 97.7%, a difference of 0.32%.
3rd Grade Correlation Summary
| Measurement | Menominee | Panamanian |
| Minimum | 97.2% | 97.4% |
| Maximum | 100.0% | 100.0% |
| Range | 2.8% | 2.6% |
| Mean | 99.0% | 99.3% |
| Median | 99.2% | 99.6% |
| Interquartile 25% (IQ1) | 98.3% | 98.5% |
| Interquartile 75% (IQ3) | 99.9% | 100.0% |
| Interquartile Range (IQR) | 1.6% | 1.5% |
| Standard Deviation (Sample) | 0.89% | 0.85% |
| Standard Deviation (Population) | 0.88% | 0.85% |
Similar Demographics by 3rd Grade
Demographics Similar to Menominee by 3rd Grade
In terms of 3rd grade, the demographic groups most similar to Menominee are Thai (98.0%, a difference of 0.0%), Okinawan (98.0%, a difference of 0.0%), Immigrants from Norway (98.0%, a difference of 0.0%), Immigrants from Latvia (98.0%, a difference of 0.010%), and Immigrants from France (98.0%, a difference of 0.010%).
| Demographics | Rating | Rank | 3rd Grade |
| Immigrants | Czechoslovakia | 97.0 /100 | #107 | Exceptional 98.0% |
| Immigrants | Singapore | 96.7 /100 | #108 | Exceptional 98.0% |
| Pima | 96.7 /100 | #109 | Exceptional 98.0% |
| Immigrants | Switzerland | 96.6 /100 | #110 | Exceptional 98.0% |
| Basques | 96.5 /100 | #111 | Exceptional 98.0% |
| Immigrants | Latvia | 96.0 /100 | #112 | Exceptional 98.0% |
| Thais | 95.5 /100 | #113 | Exceptional 98.0% |
| Menominee | 95.4 /100 | #114 | Exceptional 98.0% |
| Okinawans | 95.2 /100 | #115 | Exceptional 98.0% |
| Immigrants | Norway | 95.2 /100 | #116 | Exceptional 98.0% |
| Immigrants | France | 95.1 /100 | #117 | Exceptional 98.0% |
| Iranians | 94.9 /100 | #118 | Exceptional 98.0% |
| Spanish | 94.8 /100 | #119 | Exceptional 98.0% |
| Immigrants | Croatia | 94.4 /100 | #120 | Exceptional 98.0% |
| Iroquois | 94.1 /100 | #121 | Exceptional 98.0% |
Demographics Similar to Panamanians by 3rd Grade
In terms of 3rd grade, the demographic groups most similar to Panamanians are Native/Alaskan (97.7%, a difference of 0.010%), Immigrants from Taiwan (97.7%, a difference of 0.010%), Pakistani (97.7%, a difference of 0.010%), Black/African American (97.7%, a difference of 0.010%), and Mongolian (97.7%, a difference of 0.010%).
| Demographics | Rating | Rank | 3rd Grade |
| Arabs | 40.0 /100 | #183 | Fair 97.7% |
| Immigrants | Kazakhstan | 37.4 /100 | #184 | Fair 97.7% |
| Immigrants | Argentina | 37.0 /100 | #185 | Fair 97.7% |
| Portuguese | 36.2 /100 | #186 | Fair 97.7% |
| Natives/Alaskans | 35.2 /100 | #187 | Fair 97.7% |
| Immigrants | Taiwan | 34.2 /100 | #188 | Fair 97.7% |
| Pakistanis | 34.2 /100 | #189 | Fair 97.7% |
| Panamanians | 31.5 /100 | #190 | Fair 97.7% |
| Blacks/African Americans | 29.6 /100 | #191 | Fair 97.7% |
| Mongolians | 29.1 /100 | #192 | Fair 97.7% |
| Immigrants | Kenya | 28.2 /100 | #193 | Fair 97.7% |
| Immigrants | Uganda | 27.4 /100 | #194 | Fair 97.7% |
| Immigrants | Egypt | 26.8 /100 | #195 | Fair 97.7% |
| Paraguayans | 26.2 /100 | #196 | Fair 97.7% |
| Hawaiians | 25.7 /100 | #197 | Fair 97.7% |