Iraqi vs Panamanian Average Family Size
COMPARE
Iraqi
Panamanian
Average Family Size
Average Family Size Comparison
Iraqis
Panamanians
3.24
AVERAGE FAMILY SIZE
64.3/ 100
METRIC RATING
158th/ 347
METRIC RANK
3.25
AVERAGE FAMILY SIZE
84.2/ 100
METRIC RATING
135th/ 347
METRIC RANK
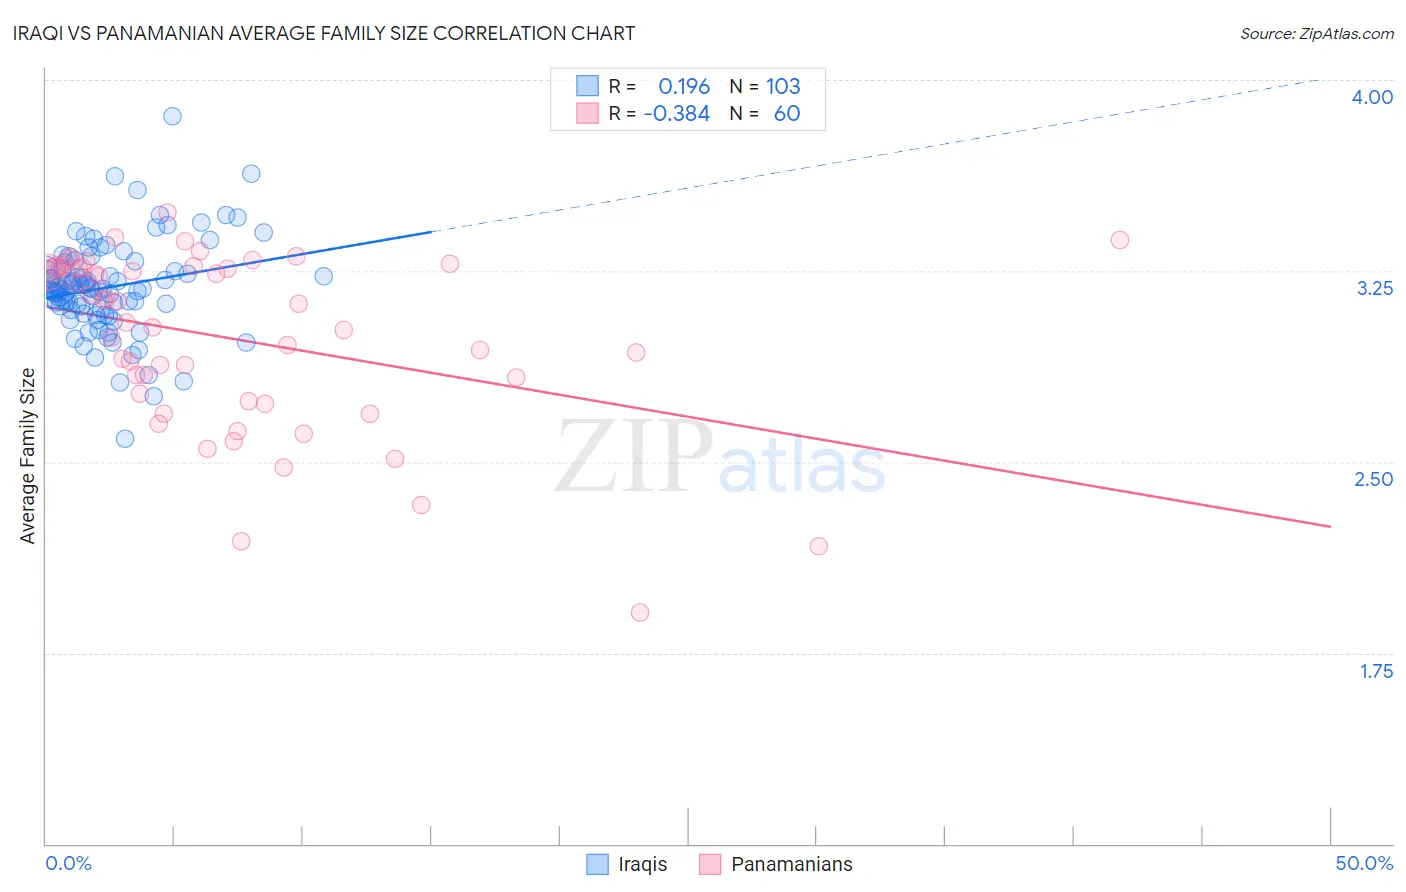
Iraqi vs Panamanian Average Family Size Correlation Chart
The statistical analysis conducted on geographies consisting of 170,567,061 people shows a poor positive correlation between the proportion of Iraqis and average family size in the United States with a correlation coefficient (R) of 0.196 and weighted average of 3.24. Similarly, the statistical analysis conducted on geographies consisting of 281,072,582 people shows a mild negative correlation between the proportion of Panamanians and average family size in the United States with a correlation coefficient (R) of -0.384 and weighted average of 3.25, a difference of 0.49%.
Average Family Size Correlation Summary
| Measurement | Iraqi | Panamanian |
| Minimum | 2.59 | 1.91 |
| Maximum | 3.86 | 3.48 |
| Range | 1.27 | 1.57 |
| Mean | 3.19 | 2.98 |
| Median | 3.18 | 3.08 |
| Interquartile 25% (IQ1) | 3.10 | 2.75 |
| Interquartile 75% (IQ3) | 3.26 | 3.26 |
| Interquartile Range (IQR) | 0.16 | 0.51 |
| Standard Deviation (Sample) | 0.18 | 0.35 |
| Standard Deviation (Population) | 0.18 | 0.34 |
Similar Demographics by Average Family Size
Demographics Similar to Iraqis by Average Family Size
In terms of average family size, the demographic groups most similar to Iraqis are Ethiopian (3.24, a difference of 0.010%), Immigrants from Iraq (3.24, a difference of 0.010%), Immigrants from Chile (3.24, a difference of 0.020%), Immigrants from Uzbekistan (3.24, a difference of 0.050%), and Seminole (3.24, a difference of 0.080%).
| Demographics | Rating | Rank | Average Family Size |
| Jordanians | 73.5 /100 | #151 | Good 3.24 |
| Spanish Americans | 72.5 /100 | #152 | Good 3.24 |
| Immigrants | Eritrea | 71.4 /100 | #153 | Good 3.24 |
| Immigrants | Egypt | 70.0 /100 | #154 | Good 3.24 |
| Seminole | 68.2 /100 | #155 | Good 3.24 |
| Immigrants | Taiwan | 68.1 /100 | #156 | Good 3.24 |
| Immigrants | Uzbekistan | 67.0 /100 | #157 | Good 3.24 |
| Iraqis | 64.3 /100 | #158 | Good 3.24 |
| Ethiopians | 63.9 /100 | #159 | Good 3.24 |
| Immigrants | Iraq | 63.7 /100 | #160 | Good 3.24 |
| Immigrants | Chile | 63.2 /100 | #161 | Good 3.24 |
| Immigrants | Uganda | 60.1 /100 | #162 | Good 3.23 |
| Uruguayans | 58.8 /100 | #163 | Average 3.23 |
| Egyptians | 58.6 /100 | #164 | Average 3.23 |
| Ugandans | 58.4 /100 | #165 | Average 3.23 |
Demographics Similar to Panamanians by Average Family Size
In terms of average family size, the demographic groups most similar to Panamanians are African (3.25, a difference of 0.020%), Comanche (3.25, a difference of 0.050%), Immigrants from Middle Africa (3.25, a difference of 0.060%), Immigrants from Venezuela (3.26, a difference of 0.070%), and Cuban (3.25, a difference of 0.080%).
| Demographics | Rating | Rank | Average Family Size |
| Colombians | 89.9 /100 | #128 | Excellent 3.26 |
| Immigrants | Hong Kong | 88.6 /100 | #129 | Excellent 3.26 |
| Laotians | 88.5 /100 | #130 | Excellent 3.26 |
| Immigrants | Western Asia | 87.7 /100 | #131 | Excellent 3.26 |
| Costa Ricans | 86.8 /100 | #132 | Excellent 3.26 |
| Immigrants | Venezuela | 86.3 /100 | #133 | Excellent 3.26 |
| Africans | 84.9 /100 | #134 | Excellent 3.25 |
| Panamanians | 84.2 /100 | #135 | Excellent 3.25 |
| Comanche | 82.8 /100 | #136 | Excellent 3.25 |
| Immigrants | Middle Africa | 82.4 /100 | #137 | Excellent 3.25 |
| Cubans | 81.8 /100 | #138 | Excellent 3.25 |
| Immigrants | Ethiopia | 81.6 /100 | #139 | Excellent 3.25 |
| Sub-Saharan Africans | 81.6 /100 | #140 | Excellent 3.25 |
| Venezuelans | 81.4 /100 | #141 | Excellent 3.25 |
| Liberians | 81.2 /100 | #142 | Excellent 3.25 |