Lumbee vs Panamanian Average Family Size
COMPARE
Lumbee
Panamanian
Average Family Size
Average Family Size Comparison
Lumbee
Panamanians
3.32
AVERAGE FAMILY SIZE
99.8/ 100
METRIC RATING
80th/ 347
METRIC RANK
3.25
AVERAGE FAMILY SIZE
84.2/ 100
METRIC RATING
135th/ 347
METRIC RANK
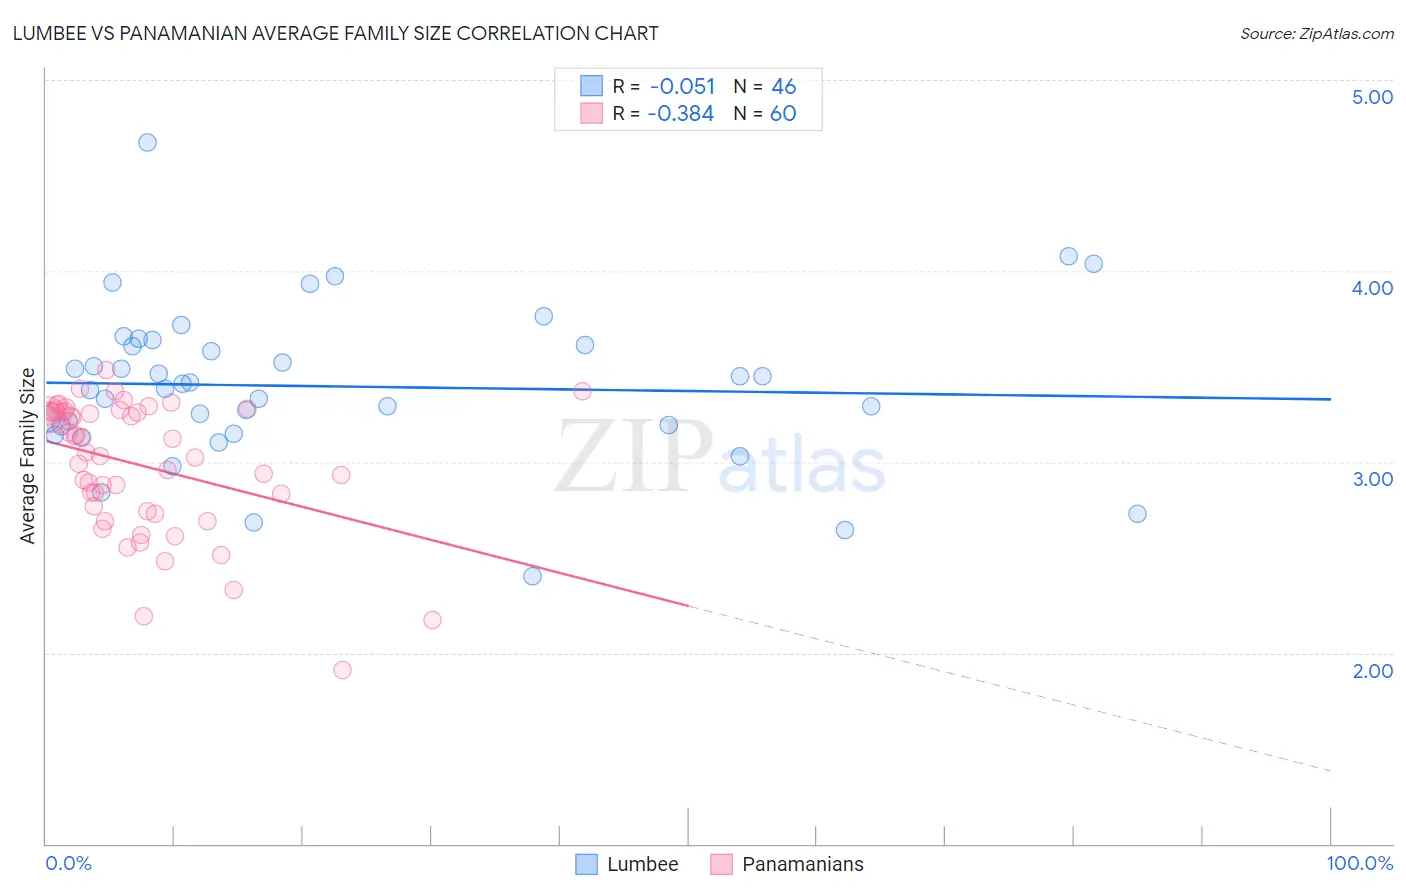
Lumbee vs Panamanian Average Family Size Correlation Chart
The statistical analysis conducted on geographies consisting of 92,265,029 people shows a slight negative correlation between the proportion of Lumbee and average family size in the United States with a correlation coefficient (R) of -0.051 and weighted average of 3.32. Similarly, the statistical analysis conducted on geographies consisting of 281,072,582 people shows a mild negative correlation between the proportion of Panamanians and average family size in the United States with a correlation coefficient (R) of -0.384 and weighted average of 3.25, a difference of 2.1%.
Average Family Size Correlation Summary
| Measurement | Lumbee | Panamanian |
| Minimum | 2.40 | 1.91 |
| Maximum | 4.67 | 3.48 |
| Range | 2.27 | 1.57 |
| Mean | 3.40 | 2.98 |
| Median | 3.40 | 3.08 |
| Interquartile 25% (IQ1) | 3.19 | 2.75 |
| Interquartile 75% (IQ3) | 3.61 | 3.26 |
| Interquartile Range (IQR) | 0.42 | 0.51 |
| Standard Deviation (Sample) | 0.41 | 0.35 |
| Standard Deviation (Population) | 0.41 | 0.34 |
Similar Demographics by Average Family Size
Demographics Similar to Lumbee by Average Family Size
In terms of average family size, the demographic groups most similar to Lumbee are British West Indian (3.32, a difference of 0.020%), Immigrants from Micronesia (3.32, a difference of 0.030%), Immigrants from Dominica (3.32, a difference of 0.040%), Immigrants from Ecuador (3.32, a difference of 0.070%), and Trinidadian and Tobagonian (3.32, a difference of 0.080%).
| Demographics | Rating | Rank | Average Family Size |
| Yaqui | 99.9 /100 | #73 | Exceptional 3.32 |
| Immigrants | Sierra Leone | 99.9 /100 | #74 | Exceptional 3.32 |
| Immigrants | Barbados | 99.8 /100 | #75 | Exceptional 3.32 |
| Trinidadians and Tobagonians | 99.8 /100 | #76 | Exceptional 3.32 |
| Immigrants | Ecuador | 99.8 /100 | #77 | Exceptional 3.32 |
| Immigrants | Micronesia | 99.8 /100 | #78 | Exceptional 3.32 |
| British West Indians | 99.8 /100 | #79 | Exceptional 3.32 |
| Lumbee | 99.8 /100 | #80 | Exceptional 3.32 |
| Immigrants | Dominica | 99.8 /100 | #81 | Exceptional 3.32 |
| Ecuadorians | 99.8 /100 | #82 | Exceptional 3.32 |
| Immigrants | Afghanistan | 99.8 /100 | #83 | Exceptional 3.32 |
| Immigrants | Nigeria | 99.7 /100 | #84 | Exceptional 3.32 |
| Afghans | 99.7 /100 | #85 | Exceptional 3.31 |
| Jamaicans | 99.7 /100 | #86 | Exceptional 3.31 |
| Immigrants | Peru | 99.7 /100 | #87 | Exceptional 3.31 |
Demographics Similar to Panamanians by Average Family Size
In terms of average family size, the demographic groups most similar to Panamanians are African (3.25, a difference of 0.020%), Comanche (3.25, a difference of 0.050%), Immigrants from Middle Africa (3.25, a difference of 0.060%), Immigrants from Venezuela (3.26, a difference of 0.070%), and Cuban (3.25, a difference of 0.080%).
| Demographics | Rating | Rank | Average Family Size |
| Colombians | 89.9 /100 | #128 | Excellent 3.26 |
| Immigrants | Hong Kong | 88.6 /100 | #129 | Excellent 3.26 |
| Laotians | 88.5 /100 | #130 | Excellent 3.26 |
| Immigrants | Western Asia | 87.7 /100 | #131 | Excellent 3.26 |
| Costa Ricans | 86.8 /100 | #132 | Excellent 3.26 |
| Immigrants | Venezuela | 86.3 /100 | #133 | Excellent 3.26 |
| Africans | 84.9 /100 | #134 | Excellent 3.25 |
| Panamanians | 84.2 /100 | #135 | Excellent 3.25 |
| Comanche | 82.8 /100 | #136 | Excellent 3.25 |
| Immigrants | Middle Africa | 82.4 /100 | #137 | Excellent 3.25 |
| Cubans | 81.8 /100 | #138 | Excellent 3.25 |
| Immigrants | Ethiopia | 81.6 /100 | #139 | Excellent 3.25 |
| Sub-Saharan Africans | 81.6 /100 | #140 | Excellent 3.25 |
| Venezuelans | 81.4 /100 | #141 | Excellent 3.25 |
| Liberians | 81.2 /100 | #142 | Excellent 3.25 |