Menominee vs Panamanian GED/Equivalency
COMPARE
Menominee
Panamanian
GED/Equivalency
GED/Equivalency Comparison
Menominee
Panamanians
86.3%
GED/EQUIVALENCY
79.3/ 100
METRIC RATING
149th/ 347
METRIC RANK
85.0%
GED/EQUIVALENCY
15.3/ 100
METRIC RATING
203rd/ 347
METRIC RANK
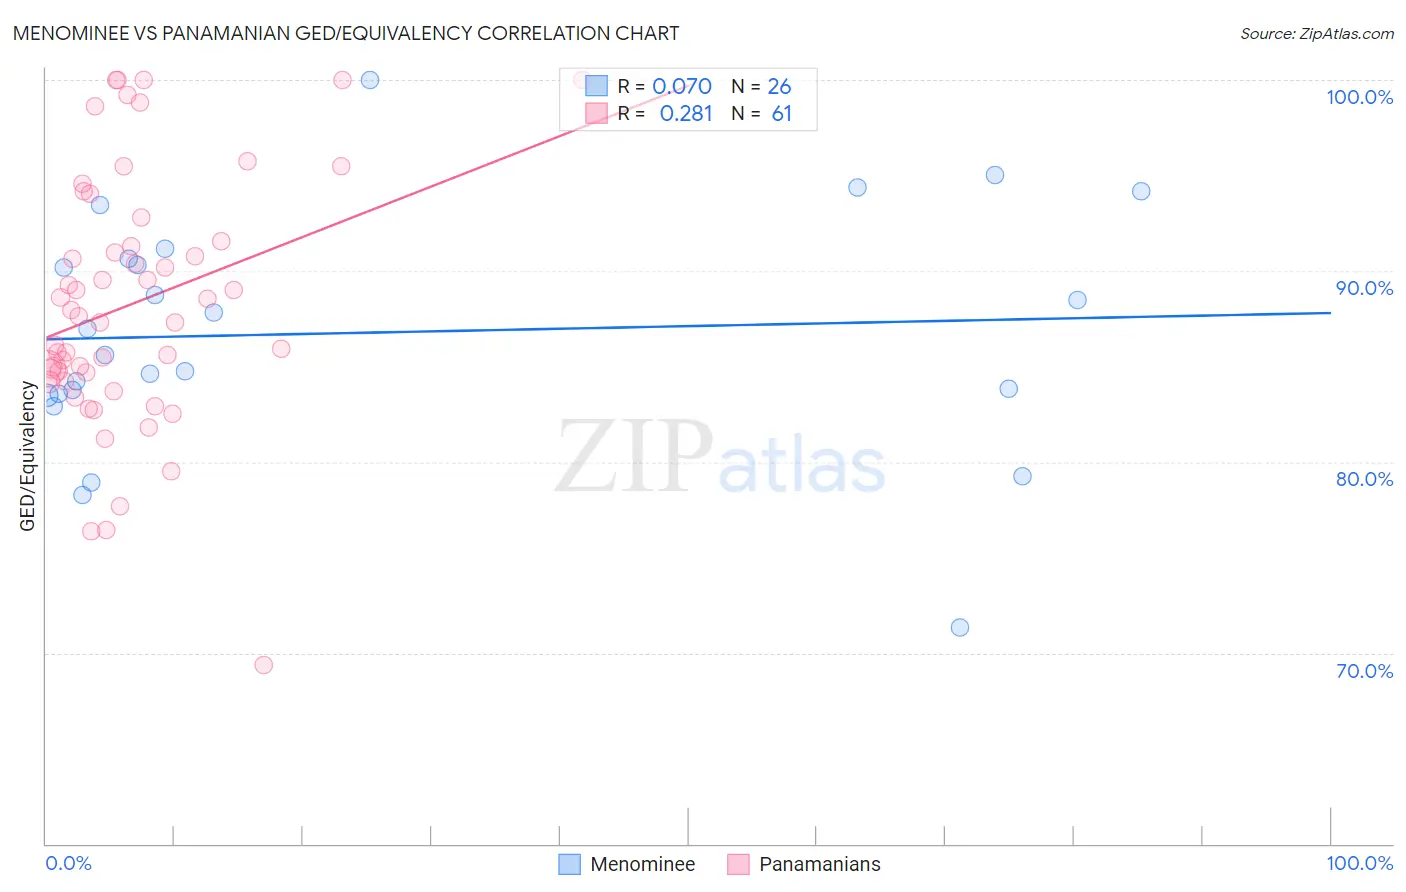
Menominee vs Panamanian GED/Equivalency Correlation Chart
The statistical analysis conducted on geographies consisting of 45,778,979 people shows a slight positive correlation between the proportion of Menominee and percentage of population with at least ged/equivalency education in the United States with a correlation coefficient (R) of 0.070 and weighted average of 86.3%. Similarly, the statistical analysis conducted on geographies consisting of 281,248,812 people shows a weak positive correlation between the proportion of Panamanians and percentage of population with at least ged/equivalency education in the United States with a correlation coefficient (R) of 0.281 and weighted average of 85.0%, a difference of 1.6%.
GED/Equivalency Correlation Summary
| Measurement | Menominee | Panamanian |
| Minimum | 71.3% | 69.4% |
| Maximum | 100.0% | 100.0% |
| Range | 28.7% | 30.6% |
| Mean | 86.8% | 88.3% |
| Median | 86.3% | 87.6% |
| Interquartile 25% (IQ1) | 83.6% | 84.4% |
| Interquartile 75% (IQ3) | 90.6% | 92.2% |
| Interquartile Range (IQR) | 7.1% | 7.7% |
| Standard Deviation (Sample) | 6.2% | 6.6% |
| Standard Deviation (Population) | 6.1% | 6.5% |
Similar Demographics by GED/Equivalency
Demographics Similar to Menominee by GED/Equivalency
In terms of ged/equivalency, the demographic groups most similar to Menominee are Immigrants from Northern Africa (86.3%, a difference of 0.0%), Immigrants from Poland (86.3%, a difference of 0.0%), Basque (86.4%, a difference of 0.010%), Immigrants from Western Asia (86.3%, a difference of 0.010%), and Pakistani (86.4%, a difference of 0.040%).
| Demographics | Rating | Rank | GED/Equivalency |
| Immigrants | Indonesia | 82.4 /100 | #142 | Excellent 86.4% |
| Immigrants | Pakistan | 82.4 /100 | #143 | Excellent 86.4% |
| Bolivians | 82.1 /100 | #144 | Excellent 86.4% |
| Pakistanis | 80.4 /100 | #145 | Excellent 86.4% |
| Basques | 79.5 /100 | #146 | Good 86.4% |
| Immigrants | Northern Africa | 79.3 /100 | #147 | Good 86.3% |
| Immigrants | Poland | 79.3 /100 | #148 | Good 86.3% |
| Menominee | 79.3 /100 | #149 | Good 86.3% |
| Immigrants | Western Asia | 78.8 /100 | #150 | Good 86.3% |
| Immigrants | Bosnia and Herzegovina | 77.9 /100 | #151 | Good 86.3% |
| Brazilians | 77.2 /100 | #152 | Good 86.3% |
| Kenyans | 76.6 /100 | #153 | Good 86.3% |
| Armenians | 76.4 /100 | #154 | Good 86.3% |
| Iraqis | 75.2 /100 | #155 | Good 86.2% |
| Immigrants | Nepal | 73.3 /100 | #156 | Good 86.2% |
Demographics Similar to Panamanians by GED/Equivalency
In terms of ged/equivalency, the demographic groups most similar to Panamanians are Hawaiian (85.0%, a difference of 0.0%), Portuguese (85.0%, a difference of 0.020%), Cree (85.0%, a difference of 0.020%), Uruguayan (85.0%, a difference of 0.030%), and Liberian (85.0%, a difference of 0.030%).
| Demographics | Rating | Rank | GED/Equivalency |
| Tongans | 20.7 /100 | #196 | Fair 85.2% |
| Costa Ricans | 20.4 /100 | #197 | Fair 85.2% |
| Immigrants | Africa | 17.5 /100 | #198 | Poor 85.1% |
| Somalis | 16.4 /100 | #199 | Poor 85.0% |
| Uruguayans | 16.0 /100 | #200 | Poor 85.0% |
| Portuguese | 15.9 /100 | #201 | Poor 85.0% |
| Cree | 15.9 /100 | #202 | Poor 85.0% |
| Panamanians | 15.3 /100 | #203 | Poor 85.0% |
| Hawaiians | 15.2 /100 | #204 | Poor 85.0% |
| Liberians | 14.6 /100 | #205 | Poor 85.0% |
| Samoans | 13.7 /100 | #206 | Poor 84.9% |
| Hmong | 13.1 /100 | #207 | Poor 84.9% |
| Marshallese | 12.5 /100 | #208 | Poor 84.9% |
| Colombians | 12.3 /100 | #209 | Poor 84.9% |
| Immigrants | Cameroon | 12.1 /100 | #210 | Poor 84.9% |