Immigrants from Bahamas vs Immigrants from Belarus Average Family Size
COMPARE
Immigrants from Bahamas
Immigrants from Belarus
Average Family Size
Average Family Size Comparison
Immigrants from Bahamas
Immigrants from Belarus
3.27
AVERAGE FAMILY SIZE
93.6/ 100
METRIC RATING
120th/ 347
METRIC RANK
3.17
AVERAGE FAMILY SIZE
2.3/ 100
METRIC RATING
248th/ 347
METRIC RANK
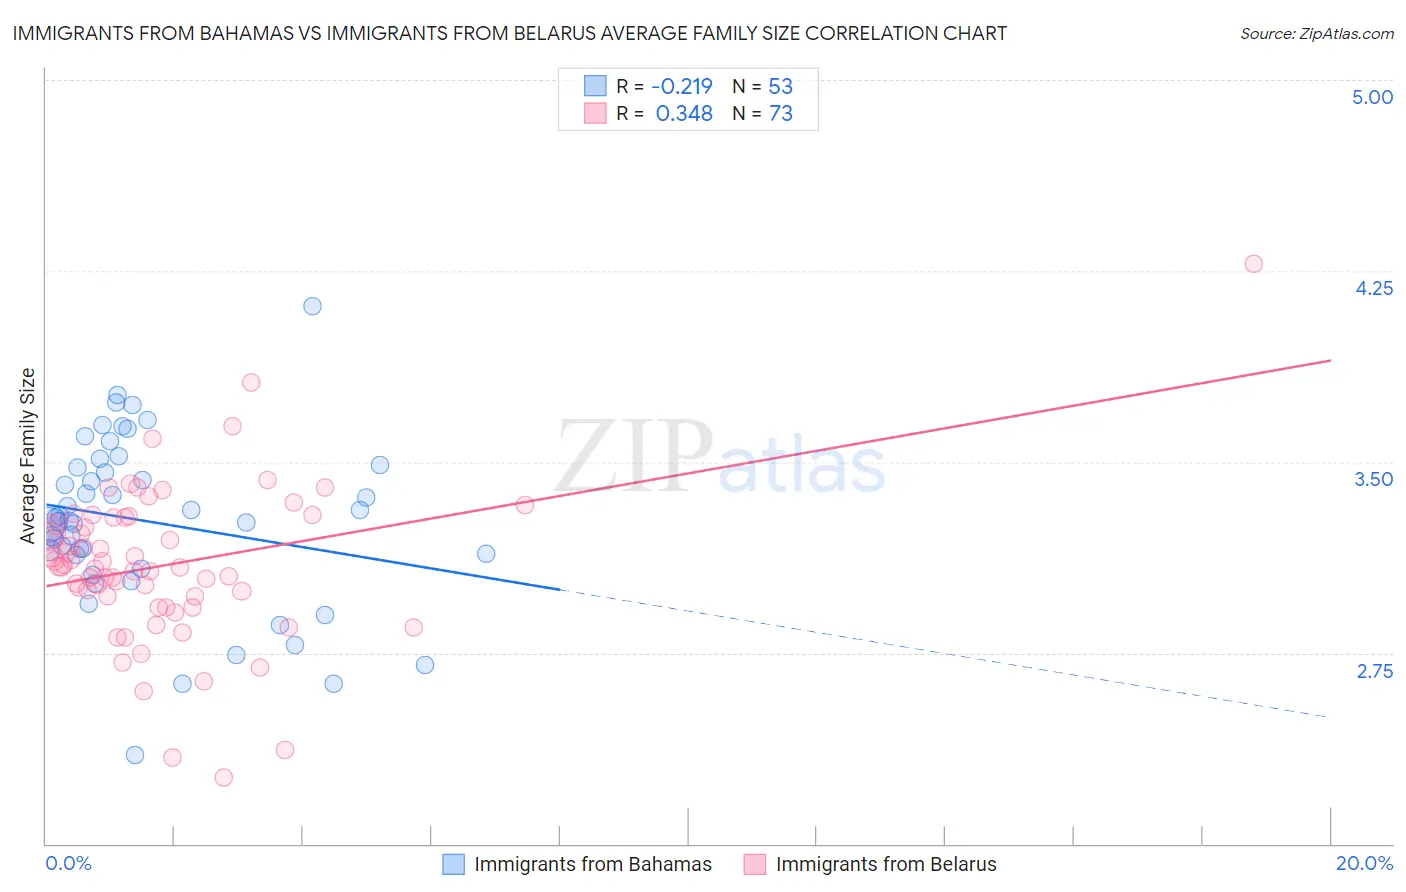
Immigrants from Bahamas vs Immigrants from Belarus Average Family Size Correlation Chart
The statistical analysis conducted on geographies consisting of 104,605,008 people shows a weak negative correlation between the proportion of Immigrants from Bahamas and average family size in the United States with a correlation coefficient (R) of -0.219 and weighted average of 3.27. Similarly, the statistical analysis conducted on geographies consisting of 150,189,025 people shows a mild positive correlation between the proportion of Immigrants from Belarus and average family size in the United States with a correlation coefficient (R) of 0.348 and weighted average of 3.17, a difference of 3.0%.
Average Family Size Correlation Summary
| Measurement | Immigrants from Bahamas | Immigrants from Belarus |
| Minimum | 2.35 | 2.26 |
| Maximum | 4.11 | 4.28 |
| Range | 1.76 | 2.02 |
| Mean | 3.26 | 3.10 |
| Median | 3.27 | 3.09 |
| Interquartile 25% (IQ1) | 3.11 | 2.95 |
| Interquartile 75% (IQ3) | 3.48 | 3.28 |
| Interquartile Range (IQR) | 0.38 | 0.33 |
| Standard Deviation (Sample) | 0.33 | 0.31 |
| Standard Deviation (Population) | 0.33 | 0.31 |
Similar Demographics by Average Family Size
Demographics Similar to Immigrants from Bahamas by Average Family Size
In terms of average family size, the demographic groups most similar to Immigrants from Bahamas are Immigrants from Indonesia (3.27, a difference of 0.010%), Immigrants from Thailand (3.27, a difference of 0.020%), Immigrants from Asia (3.27, a difference of 0.030%), Immigrants from Colombia (3.27, a difference of 0.060%), and Alaskan Athabascan (3.27, a difference of 0.080%).
| Demographics | Rating | Rank | Average Family Size |
| Immigrants | Panama | 95.6 /100 | #113 | Exceptional 3.27 |
| South Americans | 95.1 /100 | #114 | Exceptional 3.27 |
| Immigrants | Liberia | 95.0 /100 | #115 | Exceptional 3.27 |
| Immigrants | South America | 95.0 /100 | #116 | Exceptional 3.27 |
| Kiowa | 94.8 /100 | #117 | Exceptional 3.27 |
| Immigrants | Asia | 94.0 /100 | #118 | Exceptional 3.27 |
| Immigrants | Indonesia | 93.7 /100 | #119 | Exceptional 3.27 |
| Immigrants | Bahamas | 93.6 /100 | #120 | Exceptional 3.27 |
| Immigrants | Thailand | 93.3 /100 | #121 | Exceptional 3.27 |
| Immigrants | Colombia | 92.8 /100 | #122 | Exceptional 3.27 |
| Alaskan Athabascans | 92.4 /100 | #123 | Exceptional 3.27 |
| South American Indians | 91.6 /100 | #124 | Exceptional 3.26 |
| Immigrants | Cuba | 91.3 /100 | #125 | Exceptional 3.26 |
| Immigrants | Costa Rica | 90.7 /100 | #126 | Exceptional 3.26 |
| Immigrants | Syria | 90.6 /100 | #127 | Exceptional 3.26 |
Demographics Similar to Immigrants from Belarus by Average Family Size
In terms of average family size, the demographic groups most similar to Immigrants from Belarus are Cajun (3.17, a difference of 0.030%), Danish (3.17, a difference of 0.040%), Immigrants from Eastern Europe (3.17, a difference of 0.040%), Immigrants from Brazil (3.18, a difference of 0.080%), and Puget Sound Salish (3.17, a difference of 0.10%).
| Demographics | Rating | Rank | Average Family Size |
| Immigrants | Japan | 3.0 /100 | #241 | Tragic 3.18 |
| Hungarians | 3.0 /100 | #242 | Tragic 3.18 |
| Immigrants | Moldova | 2.9 /100 | #243 | Tragic 3.18 |
| Immigrants | Southern Europe | 2.9 /100 | #244 | Tragic 3.18 |
| Immigrants | Brazil | 2.7 /100 | #245 | Tragic 3.18 |
| Danes | 2.5 /100 | #246 | Tragic 3.17 |
| Cajuns | 2.4 /100 | #247 | Tragic 3.17 |
| Immigrants | Belarus | 2.3 /100 | #248 | Tragic 3.17 |
| Immigrants | Eastern Europe | 2.1 /100 | #249 | Tragic 3.17 |
| Puget Sound Salish | 1.9 /100 | #250 | Tragic 3.17 |
| Immigrants | Spain | 1.8 /100 | #251 | Tragic 3.17 |
| Immigrants | Saudi Arabia | 1.7 /100 | #252 | Tragic 3.17 |
| South Africans | 1.7 /100 | #253 | Tragic 3.17 |
| Immigrants | Hungary | 1.7 /100 | #254 | Tragic 3.17 |
| Cape Verdeans | 1.6 /100 | #255 | Tragic 3.17 |