Cypriot vs Immigrants from Belarus Average Family Size
COMPARE
Cypriot
Immigrants from Belarus
Average Family Size
Average Family Size Comparison
Cypriots
Immigrants from Belarus
3.14
AVERAGE FAMILY SIZE
0.3/ 100
METRIC RATING
290th/ 347
METRIC RANK
3.17
AVERAGE FAMILY SIZE
2.3/ 100
METRIC RATING
248th/ 347
METRIC RANK
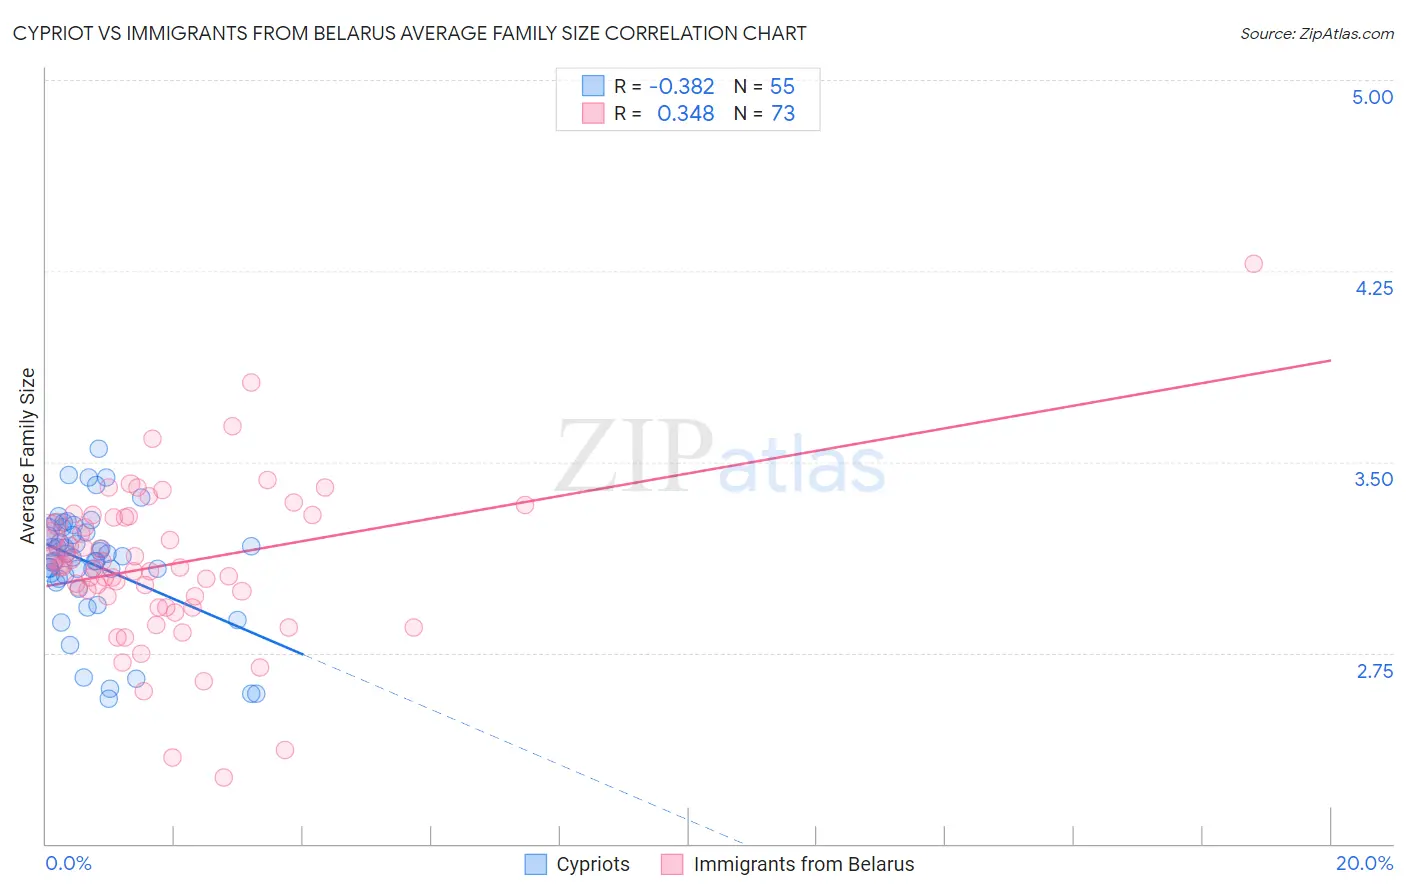
Cypriot vs Immigrants from Belarus Average Family Size Correlation Chart
The statistical analysis conducted on geographies consisting of 61,854,678 people shows a mild negative correlation between the proportion of Cypriots and average family size in the United States with a correlation coefficient (R) of -0.382 and weighted average of 3.14. Similarly, the statistical analysis conducted on geographies consisting of 150,189,025 people shows a mild positive correlation between the proportion of Immigrants from Belarus and average family size in the United States with a correlation coefficient (R) of 0.348 and weighted average of 3.17, a difference of 1.0%.
Average Family Size Correlation Summary
| Measurement | Cypriot | Immigrants from Belarus |
| Minimum | 2.57 | 2.26 |
| Maximum | 3.55 | 4.28 |
| Range | 0.98 | 2.02 |
| Mean | 3.10 | 3.10 |
| Median | 3.13 | 3.09 |
| Interquartile 25% (IQ1) | 3.04 | 2.95 |
| Interquartile 75% (IQ3) | 3.23 | 3.28 |
| Interquartile Range (IQR) | 0.19 | 0.33 |
| Standard Deviation (Sample) | 0.22 | 0.31 |
| Standard Deviation (Population) | 0.22 | 0.31 |
Similar Demographics by Average Family Size
Demographics Similar to Cypriots by Average Family Size
In terms of average family size, the demographic groups most similar to Cypriots are Greek (3.14, a difference of 0.030%), Immigrants from Czechoslovakia (3.14, a difference of 0.030%), Immigrants from Norway (3.14, a difference of 0.030%), Immigrants from Netherlands (3.14, a difference of 0.040%), and Alsatian (3.14, a difference of 0.040%).
| Demographics | Rating | Rank | Average Family Size |
| German Russians | 0.4 /100 | #283 | Tragic 3.15 |
| Immigrants | France | 0.4 /100 | #284 | Tragic 3.15 |
| Whites/Caucasians | 0.3 /100 | #285 | Tragic 3.14 |
| Immigrants | Netherlands | 0.3 /100 | #286 | Tragic 3.14 |
| Greeks | 0.3 /100 | #287 | Tragic 3.14 |
| Immigrants | Czechoslovakia | 0.3 /100 | #288 | Tragic 3.14 |
| Immigrants | Norway | 0.3 /100 | #289 | Tragic 3.14 |
| Cypriots | 0.3 /100 | #290 | Tragic 3.14 |
| Alsatians | 0.2 /100 | #291 | Tragic 3.14 |
| Europeans | 0.2 /100 | #292 | Tragic 3.14 |
| Scandinavians | 0.2 /100 | #293 | Tragic 3.14 |
| Immigrants | Croatia | 0.2 /100 | #294 | Tragic 3.14 |
| Austrians | 0.2 /100 | #295 | Tragic 3.14 |
| Ukrainians | 0.2 /100 | #296 | Tragic 3.14 |
| Immigrants | Western Europe | 0.2 /100 | #297 | Tragic 3.14 |
Demographics Similar to Immigrants from Belarus by Average Family Size
In terms of average family size, the demographic groups most similar to Immigrants from Belarus are Cajun (3.17, a difference of 0.030%), Danish (3.17, a difference of 0.040%), Immigrants from Eastern Europe (3.17, a difference of 0.040%), Immigrants from Brazil (3.18, a difference of 0.080%), and Puget Sound Salish (3.17, a difference of 0.10%).
| Demographics | Rating | Rank | Average Family Size |
| Immigrants | Japan | 3.0 /100 | #241 | Tragic 3.18 |
| Hungarians | 3.0 /100 | #242 | Tragic 3.18 |
| Immigrants | Moldova | 2.9 /100 | #243 | Tragic 3.18 |
| Immigrants | Southern Europe | 2.9 /100 | #244 | Tragic 3.18 |
| Immigrants | Brazil | 2.7 /100 | #245 | Tragic 3.18 |
| Danes | 2.5 /100 | #246 | Tragic 3.17 |
| Cajuns | 2.4 /100 | #247 | Tragic 3.17 |
| Immigrants | Belarus | 2.3 /100 | #248 | Tragic 3.17 |
| Immigrants | Eastern Europe | 2.1 /100 | #249 | Tragic 3.17 |
| Puget Sound Salish | 1.9 /100 | #250 | Tragic 3.17 |
| Immigrants | Spain | 1.8 /100 | #251 | Tragic 3.17 |
| Immigrants | Saudi Arabia | 1.7 /100 | #252 | Tragic 3.17 |
| South Africans | 1.7 /100 | #253 | Tragic 3.17 |
| Immigrants | Hungary | 1.7 /100 | #254 | Tragic 3.17 |
| Cape Verdeans | 1.6 /100 | #255 | Tragic 3.17 |