Immigrants from Laos vs Immigrants from Belarus Average Family Size
COMPARE
Immigrants from Laos
Immigrants from Belarus
Average Family Size
Average Family Size Comparison
Immigrants from Laos
Immigrants from Belarus
3.34
AVERAGE FAMILY SIZE
99.9/ 100
METRIC RATING
65th/ 347
METRIC RANK
3.17
AVERAGE FAMILY SIZE
2.3/ 100
METRIC RATING
248th/ 347
METRIC RANK
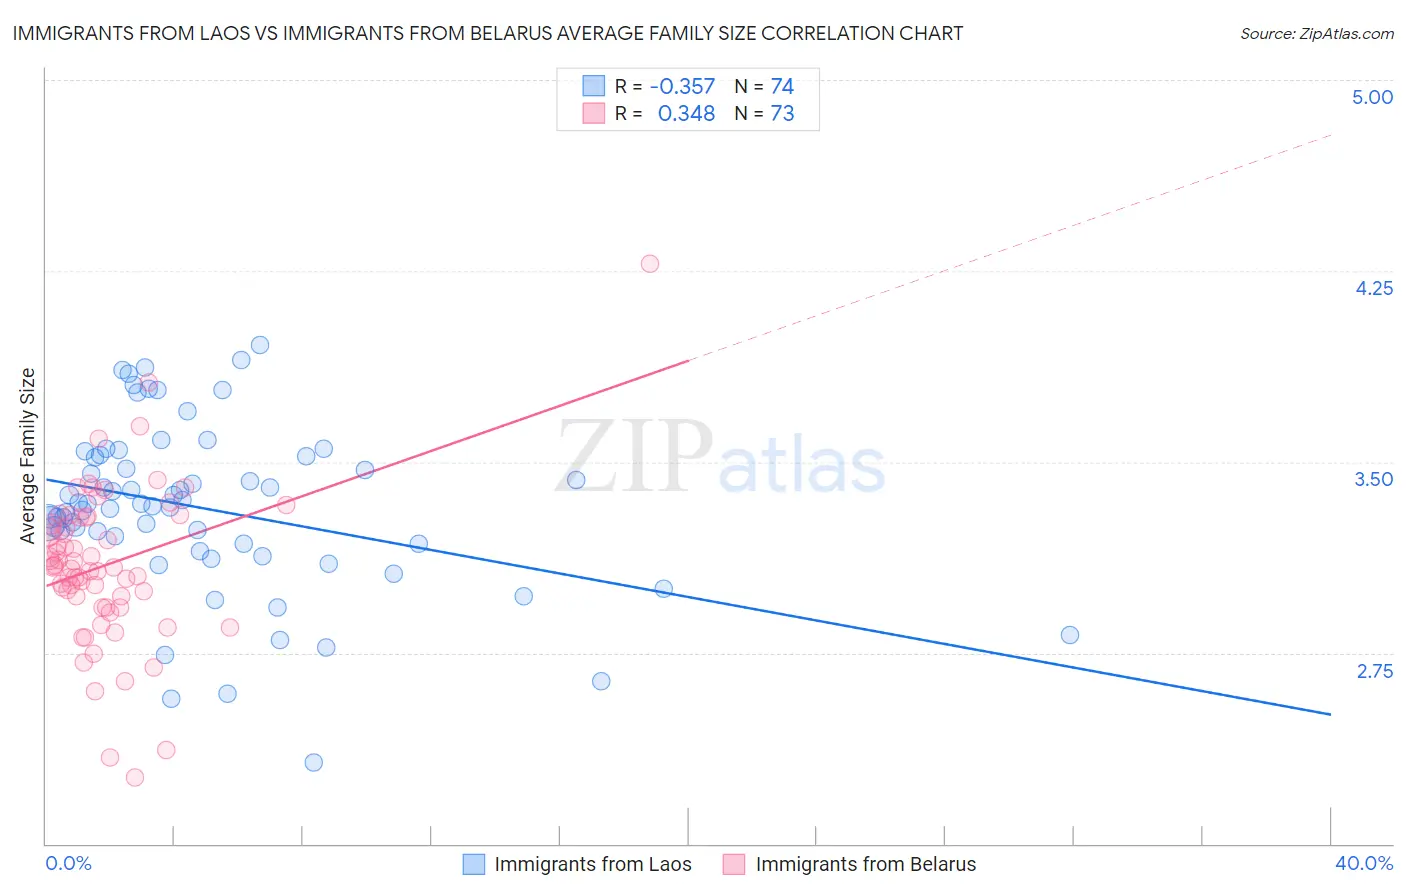
Immigrants from Laos vs Immigrants from Belarus Average Family Size Correlation Chart
The statistical analysis conducted on geographies consisting of 201,468,648 people shows a mild negative correlation between the proportion of Immigrants from Laos and average family size in the United States with a correlation coefficient (R) of -0.357 and weighted average of 3.34. Similarly, the statistical analysis conducted on geographies consisting of 150,189,025 people shows a mild positive correlation between the proportion of Immigrants from Belarus and average family size in the United States with a correlation coefficient (R) of 0.348 and weighted average of 3.17, a difference of 5.2%.
Average Family Size Correlation Summary
| Measurement | Immigrants from Laos | Immigrants from Belarus |
| Minimum | 2.32 | 2.26 |
| Maximum | 3.96 | 4.28 |
| Range | 1.64 | 2.02 |
| Mean | 3.32 | 3.10 |
| Median | 3.33 | 3.09 |
| Interquartile 25% (IQ1) | 3.18 | 2.95 |
| Interquartile 75% (IQ3) | 3.52 | 3.28 |
| Interquartile Range (IQR) | 0.34 | 0.33 |
| Standard Deviation (Sample) | 0.33 | 0.31 |
| Standard Deviation (Population) | 0.33 | 0.31 |
Similar Demographics by Average Family Size
Demographics Similar to Immigrants from Laos by Average Family Size
In terms of average family size, the demographic groups most similar to Immigrants from Laos are Dominican (3.34, a difference of 0.020%), Immigrants from St. Vincent and the Grenadines (3.34, a difference of 0.060%), Chinese (3.34, a difference of 0.090%), Immigrants from Jamaica (3.33, a difference of 0.10%), and Immigrants from Grenada (3.34, a difference of 0.11%).
| Demographics | Rating | Rank | Average Family Size |
| Hondurans | 100.0 /100 | #58 | Exceptional 3.35 |
| Japanese | 100.0 /100 | #59 | Exceptional 3.35 |
| Immigrants | Armenia | 100.0 /100 | #60 | Exceptional 3.35 |
| Central American Indians | 100.0 /100 | #61 | Exceptional 3.35 |
| Immigrants | Grenada | 100.0 /100 | #62 | Exceptional 3.34 |
| Chinese | 100.0 /100 | #63 | Exceptional 3.34 |
| Dominicans | 99.9 /100 | #64 | Exceptional 3.34 |
| Immigrants | Laos | 99.9 /100 | #65 | Exceptional 3.34 |
| Immigrants | St. Vincent and the Grenadines | 99.9 /100 | #66 | Exceptional 3.34 |
| Immigrants | Jamaica | 99.9 /100 | #67 | Exceptional 3.33 |
| Immigrants | Cambodia | 99.9 /100 | #68 | Exceptional 3.33 |
| Immigrants | Immigrants | 99.9 /100 | #69 | Exceptional 3.33 |
| Immigrants | Trinidad and Tobago | 99.9 /100 | #70 | Exceptional 3.33 |
| Immigrants | West Indies | 99.9 /100 | #71 | Exceptional 3.33 |
| Immigrants | Caribbean | 99.9 /100 | #72 | Exceptional 3.33 |
Demographics Similar to Immigrants from Belarus by Average Family Size
In terms of average family size, the demographic groups most similar to Immigrants from Belarus are Cajun (3.17, a difference of 0.030%), Danish (3.17, a difference of 0.040%), Immigrants from Eastern Europe (3.17, a difference of 0.040%), Immigrants from Brazil (3.18, a difference of 0.080%), and Puget Sound Salish (3.17, a difference of 0.10%).
| Demographics | Rating | Rank | Average Family Size |
| Immigrants | Japan | 3.0 /100 | #241 | Tragic 3.18 |
| Hungarians | 3.0 /100 | #242 | Tragic 3.18 |
| Immigrants | Moldova | 2.9 /100 | #243 | Tragic 3.18 |
| Immigrants | Southern Europe | 2.9 /100 | #244 | Tragic 3.18 |
| Immigrants | Brazil | 2.7 /100 | #245 | Tragic 3.18 |
| Danes | 2.5 /100 | #246 | Tragic 3.17 |
| Cajuns | 2.4 /100 | #247 | Tragic 3.17 |
| Immigrants | Belarus | 2.3 /100 | #248 | Tragic 3.17 |
| Immigrants | Eastern Europe | 2.1 /100 | #249 | Tragic 3.17 |
| Puget Sound Salish | 1.9 /100 | #250 | Tragic 3.17 |
| Immigrants | Spain | 1.8 /100 | #251 | Tragic 3.17 |
| Immigrants | Saudi Arabia | 1.7 /100 | #252 | Tragic 3.17 |
| South Africans | 1.7 /100 | #253 | Tragic 3.17 |
| Immigrants | Hungary | 1.7 /100 | #254 | Tragic 3.17 |
| Cape Verdeans | 1.6 /100 | #255 | Tragic 3.17 |