Uruguayan vs Immigrants from Belarus Average Family Size
COMPARE
Uruguayan
Immigrants from Belarus
Average Family Size
Average Family Size Comparison
Uruguayans
Immigrants from Belarus
3.23
AVERAGE FAMILY SIZE
58.8/ 100
METRIC RATING
163rd/ 347
METRIC RANK
3.17
AVERAGE FAMILY SIZE
2.3/ 100
METRIC RATING
248th/ 347
METRIC RANK
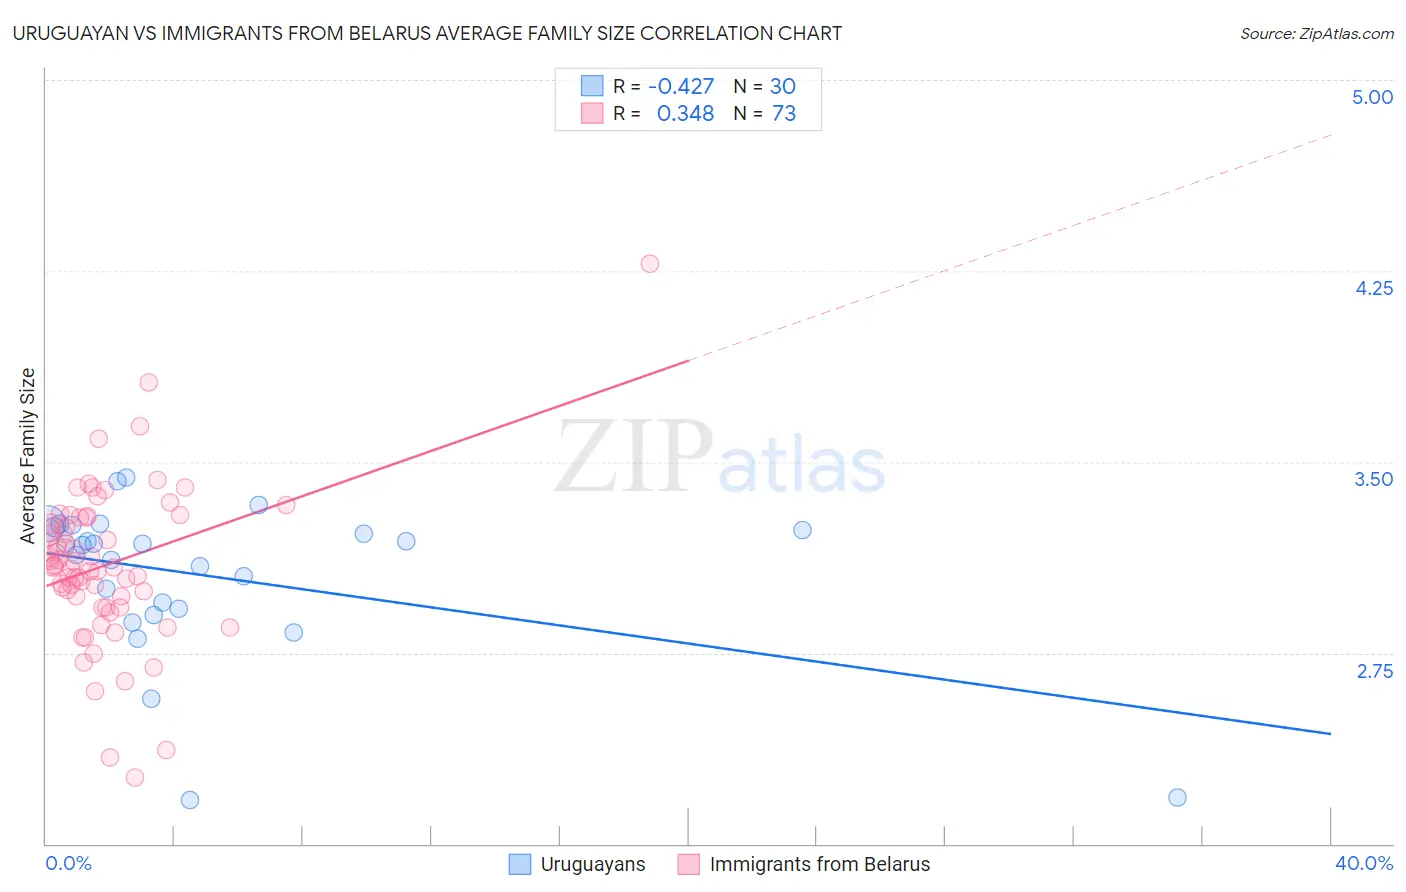
Uruguayan vs Immigrants from Belarus Average Family Size Correlation Chart
The statistical analysis conducted on geographies consisting of 144,757,082 people shows a moderate negative correlation between the proportion of Uruguayans and average family size in the United States with a correlation coefficient (R) of -0.427 and weighted average of 3.23. Similarly, the statistical analysis conducted on geographies consisting of 150,189,025 people shows a mild positive correlation between the proportion of Immigrants from Belarus and average family size in the United States with a correlation coefficient (R) of 0.348 and weighted average of 3.17, a difference of 1.9%.
Average Family Size Correlation Summary
| Measurement | Uruguayan | Immigrants from Belarus |
| Minimum | 2.17 | 2.26 |
| Maximum | 3.44 | 4.28 |
| Range | 1.27 | 2.02 |
| Mean | 3.05 | 3.10 |
| Median | 3.17 | 3.09 |
| Interquartile 25% (IQ1) | 2.92 | 2.95 |
| Interquartile 75% (IQ3) | 3.24 | 3.28 |
| Interquartile Range (IQR) | 0.32 | 0.33 |
| Standard Deviation (Sample) | 0.31 | 0.31 |
| Standard Deviation (Population) | 0.30 | 0.31 |
Similar Demographics by Average Family Size
Demographics Similar to Uruguayans by Average Family Size
In terms of average family size, the demographic groups most similar to Uruguayans are Egyptian (3.23, a difference of 0.0%), Ugandan (3.23, a difference of 0.010%), Immigrants from Uganda (3.23, a difference of 0.020%), Immigrants from Senegal (3.23, a difference of 0.030%), and Dutch West Indian (3.23, a difference of 0.040%).
| Demographics | Rating | Rank | Average Family Size |
| Immigrants | Taiwan | 68.1 /100 | #156 | Good 3.24 |
| Immigrants | Uzbekistan | 67.0 /100 | #157 | Good 3.24 |
| Iraqis | 64.3 /100 | #158 | Good 3.24 |
| Ethiopians | 63.9 /100 | #159 | Good 3.24 |
| Immigrants | Iraq | 63.7 /100 | #160 | Good 3.24 |
| Immigrants | Chile | 63.2 /100 | #161 | Good 3.24 |
| Immigrants | Uganda | 60.1 /100 | #162 | Good 3.23 |
| Uruguayans | 58.8 /100 | #163 | Average 3.23 |
| Egyptians | 58.6 /100 | #164 | Average 3.23 |
| Ugandans | 58.4 /100 | #165 | Average 3.23 |
| Immigrants | Senegal | 57.5 /100 | #166 | Average 3.23 |
| Dutch West Indians | 56.9 /100 | #167 | Average 3.23 |
| Taiwanese | 54.2 /100 | #168 | Average 3.23 |
| Aleuts | 54.1 /100 | #169 | Average 3.23 |
| Arabs | 53.8 /100 | #170 | Average 3.23 |
Demographics Similar to Immigrants from Belarus by Average Family Size
In terms of average family size, the demographic groups most similar to Immigrants from Belarus are Cajun (3.17, a difference of 0.030%), Danish (3.17, a difference of 0.040%), Immigrants from Eastern Europe (3.17, a difference of 0.040%), Immigrants from Brazil (3.18, a difference of 0.080%), and Puget Sound Salish (3.17, a difference of 0.10%).
| Demographics | Rating | Rank | Average Family Size |
| Immigrants | Japan | 3.0 /100 | #241 | Tragic 3.18 |
| Hungarians | 3.0 /100 | #242 | Tragic 3.18 |
| Immigrants | Moldova | 2.9 /100 | #243 | Tragic 3.18 |
| Immigrants | Southern Europe | 2.9 /100 | #244 | Tragic 3.18 |
| Immigrants | Brazil | 2.7 /100 | #245 | Tragic 3.18 |
| Danes | 2.5 /100 | #246 | Tragic 3.17 |
| Cajuns | 2.4 /100 | #247 | Tragic 3.17 |
| Immigrants | Belarus | 2.3 /100 | #248 | Tragic 3.17 |
| Immigrants | Eastern Europe | 2.1 /100 | #249 | Tragic 3.17 |
| Puget Sound Salish | 1.9 /100 | #250 | Tragic 3.17 |
| Immigrants | Spain | 1.8 /100 | #251 | Tragic 3.17 |
| Immigrants | Saudi Arabia | 1.7 /100 | #252 | Tragic 3.17 |
| South Africans | 1.7 /100 | #253 | Tragic 3.17 |
| Immigrants | Hungary | 1.7 /100 | #254 | Tragic 3.17 |
| Cape Verdeans | 1.6 /100 | #255 | Tragic 3.17 |