Haitian vs Immigrants from Belarus Average Family Size
COMPARE
Haitian
Immigrants from Belarus
Average Family Size
Average Family Size Comparison
Haitians
Immigrants from Belarus
3.37
AVERAGE FAMILY SIZE
100.0/ 100
METRIC RATING
46th/ 347
METRIC RANK
3.17
AVERAGE FAMILY SIZE
2.3/ 100
METRIC RATING
248th/ 347
METRIC RANK
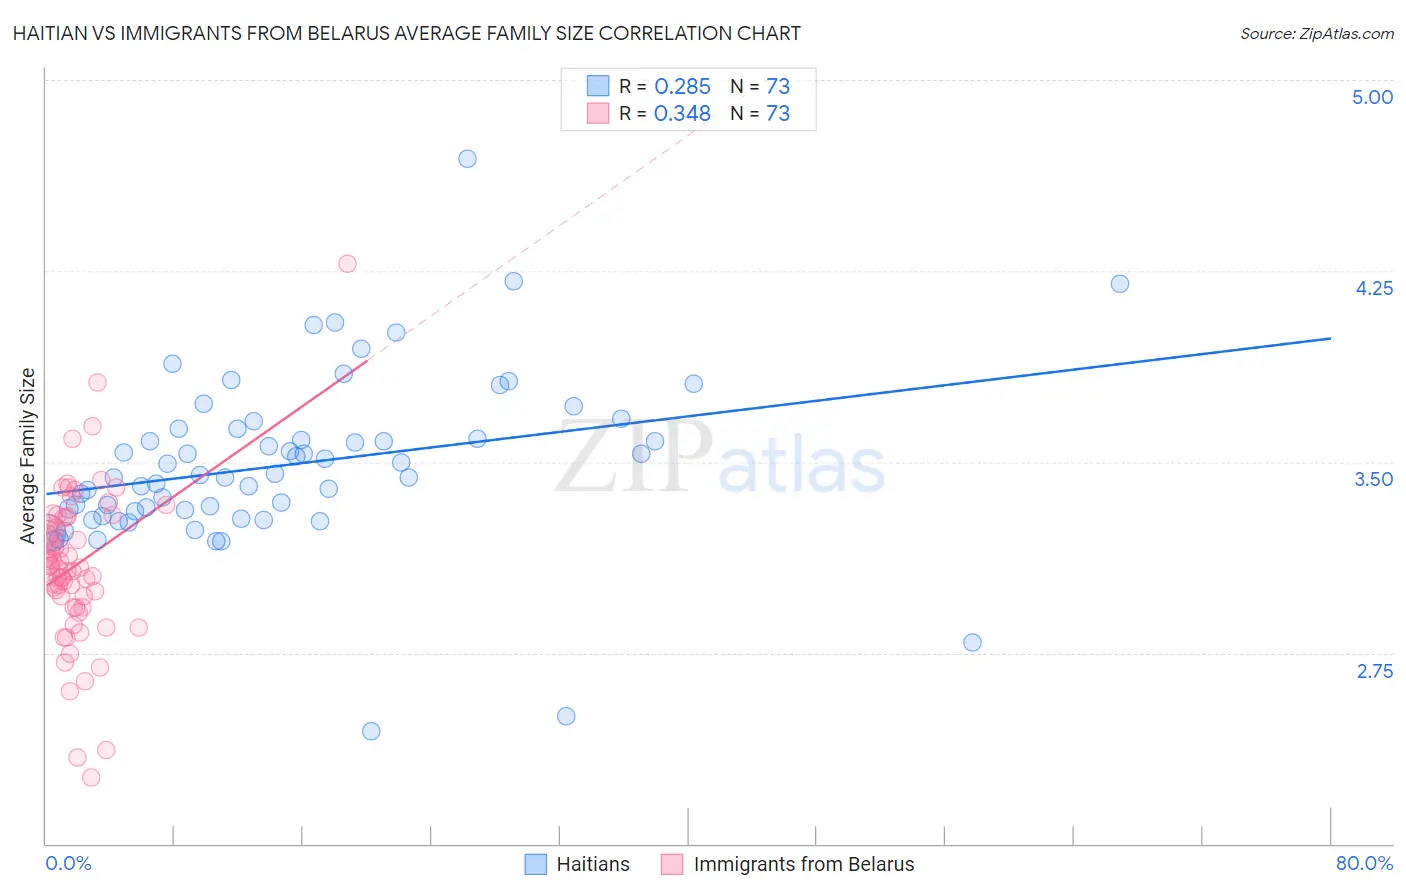
Haitian vs Immigrants from Belarus Average Family Size Correlation Chart
The statistical analysis conducted on geographies consisting of 287,712,478 people shows a weak positive correlation between the proportion of Haitians and average family size in the United States with a correlation coefficient (R) of 0.285 and weighted average of 3.37. Similarly, the statistical analysis conducted on geographies consisting of 150,189,025 people shows a mild positive correlation between the proportion of Immigrants from Belarus and average family size in the United States with a correlation coefficient (R) of 0.348 and weighted average of 3.17, a difference of 6.3%.
Average Family Size Correlation Summary
| Measurement | Haitian | Immigrants from Belarus |
| Minimum | 2.44 | 2.26 |
| Maximum | 4.69 | 4.28 |
| Range | 2.25 | 2.02 |
| Mean | 3.49 | 3.10 |
| Median | 3.45 | 3.09 |
| Interquartile 25% (IQ1) | 3.30 | 2.95 |
| Interquartile 75% (IQ3) | 3.63 | 3.28 |
| Interquartile Range (IQR) | 0.33 | 0.33 |
| Standard Deviation (Sample) | 0.34 | 0.31 |
| Standard Deviation (Population) | 0.34 | 0.31 |
Similar Demographics by Average Family Size
Demographics Similar to Haitians by Average Family Size
In terms of average family size, the demographic groups most similar to Haitians are Vietnamese (3.37, a difference of 0.040%), Immigrants from Nicaragua (3.37, a difference of 0.040%), Shoshone (3.37, a difference of 0.060%), Alaska Native (3.37, a difference of 0.090%), and Immigrants from Philippines (3.37, a difference of 0.10%).
| Demographics | Rating | Rank | Average Family Size |
| Immigrants | Haiti | 100.0 /100 | #39 | Exceptional 3.39 |
| Belizeans | 100.0 /100 | #40 | Exceptional 3.39 |
| Marshallese | 100.0 /100 | #41 | Exceptional 3.38 |
| Immigrants | Vietnam | 100.0 /100 | #42 | Exceptional 3.38 |
| Immigrants | Philippines | 100.0 /100 | #43 | Exceptional 3.37 |
| Alaska Natives | 100.0 /100 | #44 | Exceptional 3.37 |
| Shoshone | 100.0 /100 | #45 | Exceptional 3.37 |
| Haitians | 100.0 /100 | #46 | Exceptional 3.37 |
| Vietnamese | 100.0 /100 | #47 | Exceptional 3.37 |
| Immigrants | Nicaragua | 100.0 /100 | #48 | Exceptional 3.37 |
| Bangladeshis | 100.0 /100 | #49 | Exceptional 3.37 |
| Immigrants | Bangladesh | 100.0 /100 | #50 | Exceptional 3.36 |
| Nicaraguans | 100.0 /100 | #51 | Exceptional 3.36 |
| Fijians | 100.0 /100 | #52 | Exceptional 3.36 |
| Koreans | 100.0 /100 | #53 | Exceptional 3.36 |
Demographics Similar to Immigrants from Belarus by Average Family Size
In terms of average family size, the demographic groups most similar to Immigrants from Belarus are Cajun (3.17, a difference of 0.030%), Danish (3.17, a difference of 0.040%), Immigrants from Eastern Europe (3.17, a difference of 0.040%), Immigrants from Brazil (3.18, a difference of 0.080%), and Puget Sound Salish (3.17, a difference of 0.10%).
| Demographics | Rating | Rank | Average Family Size |
| Immigrants | Japan | 3.0 /100 | #241 | Tragic 3.18 |
| Hungarians | 3.0 /100 | #242 | Tragic 3.18 |
| Immigrants | Moldova | 2.9 /100 | #243 | Tragic 3.18 |
| Immigrants | Southern Europe | 2.9 /100 | #244 | Tragic 3.18 |
| Immigrants | Brazil | 2.7 /100 | #245 | Tragic 3.18 |
| Danes | 2.5 /100 | #246 | Tragic 3.17 |
| Cajuns | 2.4 /100 | #247 | Tragic 3.17 |
| Immigrants | Belarus | 2.3 /100 | #248 | Tragic 3.17 |
| Immigrants | Eastern Europe | 2.1 /100 | #249 | Tragic 3.17 |
| Puget Sound Salish | 1.9 /100 | #250 | Tragic 3.17 |
| Immigrants | Spain | 1.8 /100 | #251 | Tragic 3.17 |
| Immigrants | Saudi Arabia | 1.7 /100 | #252 | Tragic 3.17 |
| South Africans | 1.7 /100 | #253 | Tragic 3.17 |
| Immigrants | Hungary | 1.7 /100 | #254 | Tragic 3.17 |
| Cape Verdeans | 1.6 /100 | #255 | Tragic 3.17 |