French Canadian vs Immigrants from Belarus Average Family Size
COMPARE
French Canadian
Immigrants from Belarus
Average Family Size
Average Family Size Comparison
French Canadians
Immigrants from Belarus
3.07
AVERAGE FAMILY SIZE
0.0/ 100
METRIC RATING
344th/ 347
METRIC RANK
3.17
AVERAGE FAMILY SIZE
2.3/ 100
METRIC RATING
248th/ 347
METRIC RANK
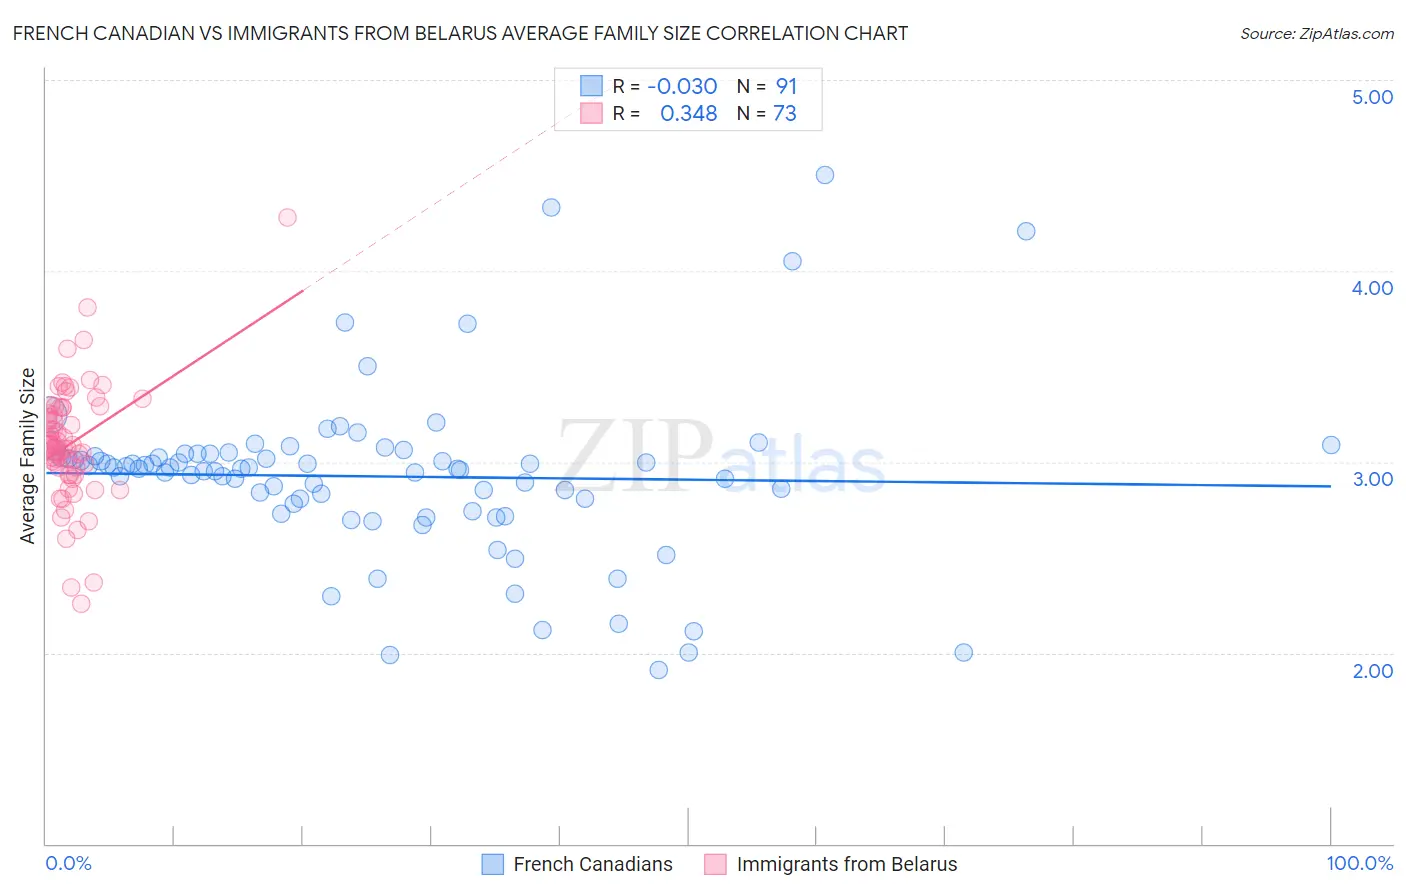
French Canadian vs Immigrants from Belarus Average Family Size Correlation Chart
The statistical analysis conducted on geographies consisting of 502,268,768 people shows no correlation between the proportion of French Canadians and average family size in the United States with a correlation coefficient (R) of -0.030 and weighted average of 3.07. Similarly, the statistical analysis conducted on geographies consisting of 150,189,025 people shows a mild positive correlation between the proportion of Immigrants from Belarus and average family size in the United States with a correlation coefficient (R) of 0.348 and weighted average of 3.17, a difference of 3.2%.
Average Family Size Correlation Summary
| Measurement | French Canadian | Immigrants from Belarus |
| Minimum | 1.91 | 2.26 |
| Maximum | 4.50 | 4.28 |
| Range | 2.59 | 2.02 |
| Mean | 2.92 | 3.10 |
| Median | 2.97 | 3.09 |
| Interquartile 25% (IQ1) | 2.78 | 2.95 |
| Interquartile 75% (IQ3) | 3.04 | 3.28 |
| Interquartile Range (IQR) | 0.26 | 0.33 |
| Standard Deviation (Sample) | 0.44 | 0.31 |
| Standard Deviation (Population) | 0.44 | 0.31 |
Similar Demographics by Average Family Size
Demographics Similar to French Canadians by Average Family Size
In terms of average family size, the demographic groups most similar to French Canadians are Slovene (3.07, a difference of 0.040%), Norwegian (3.08, a difference of 0.24%), Slovak (3.06, a difference of 0.33%), Carpatho Rusyn (3.06, a difference of 0.39%), and German (3.09, a difference of 0.47%).
| Demographics | Rating | Rank | Average Family Size |
| Estonians | 0.0 /100 | #333 | Tragic 3.10 |
| Lithuanians | 0.0 /100 | #334 | Tragic 3.10 |
| Luxembourgers | 0.0 /100 | #335 | Tragic 3.10 |
| Irish | 0.0 /100 | #336 | Tragic 3.10 |
| Swedes | 0.0 /100 | #337 | Tragic 3.10 |
| French | 0.0 /100 | #338 | Tragic 3.10 |
| Croatians | 0.0 /100 | #339 | Tragic 3.10 |
| Finns | 0.0 /100 | #340 | Tragic 3.09 |
| Poles | 0.0 /100 | #341 | Tragic 3.09 |
| Germans | 0.0 /100 | #342 | Tragic 3.09 |
| Norwegians | 0.0 /100 | #343 | Tragic 3.08 |
| French Canadians | 0.0 /100 | #344 | Tragic 3.07 |
| Slovenes | 0.0 /100 | #345 | Tragic 3.07 |
| Slovaks | 0.0 /100 | #346 | Tragic 3.06 |
| Carpatho Rusyns | 0.0 /100 | #347 | Tragic 3.06 |
Demographics Similar to Immigrants from Belarus by Average Family Size
In terms of average family size, the demographic groups most similar to Immigrants from Belarus are Cajun (3.17, a difference of 0.030%), Danish (3.17, a difference of 0.040%), Immigrants from Eastern Europe (3.17, a difference of 0.040%), Immigrants from Brazil (3.18, a difference of 0.080%), and Puget Sound Salish (3.17, a difference of 0.10%).
| Demographics | Rating | Rank | Average Family Size |
| Immigrants | Japan | 3.0 /100 | #241 | Tragic 3.18 |
| Hungarians | 3.0 /100 | #242 | Tragic 3.18 |
| Immigrants | Moldova | 2.9 /100 | #243 | Tragic 3.18 |
| Immigrants | Southern Europe | 2.9 /100 | #244 | Tragic 3.18 |
| Immigrants | Brazil | 2.7 /100 | #245 | Tragic 3.18 |
| Danes | 2.5 /100 | #246 | Tragic 3.17 |
| Cajuns | 2.4 /100 | #247 | Tragic 3.17 |
| Immigrants | Belarus | 2.3 /100 | #248 | Tragic 3.17 |
| Immigrants | Eastern Europe | 2.1 /100 | #249 | Tragic 3.17 |
| Puget Sound Salish | 1.9 /100 | #250 | Tragic 3.17 |
| Immigrants | Spain | 1.8 /100 | #251 | Tragic 3.17 |
| Immigrants | Saudi Arabia | 1.7 /100 | #252 | Tragic 3.17 |
| South Africans | 1.7 /100 | #253 | Tragic 3.17 |
| Immigrants | Hungary | 1.7 /100 | #254 | Tragic 3.17 |
| Cape Verdeans | 1.6 /100 | #255 | Tragic 3.17 |