Immigrants from Uzbekistan vs Arapaho Married-couple Households
COMPARE
Immigrants from Uzbekistan
Arapaho
Married-couple Households
Married-couple Households Comparison
Immigrants from Uzbekistan
Arapaho
45.4%
MARRIED-COUPLE HOUSEHOLDS
8.4/ 100
METRIC RATING
209th/ 347
METRIC RANK
41.8%
MARRIED-COUPLE HOUSEHOLDS
0.0/ 100
METRIC RATING
297th/ 347
METRIC RANK
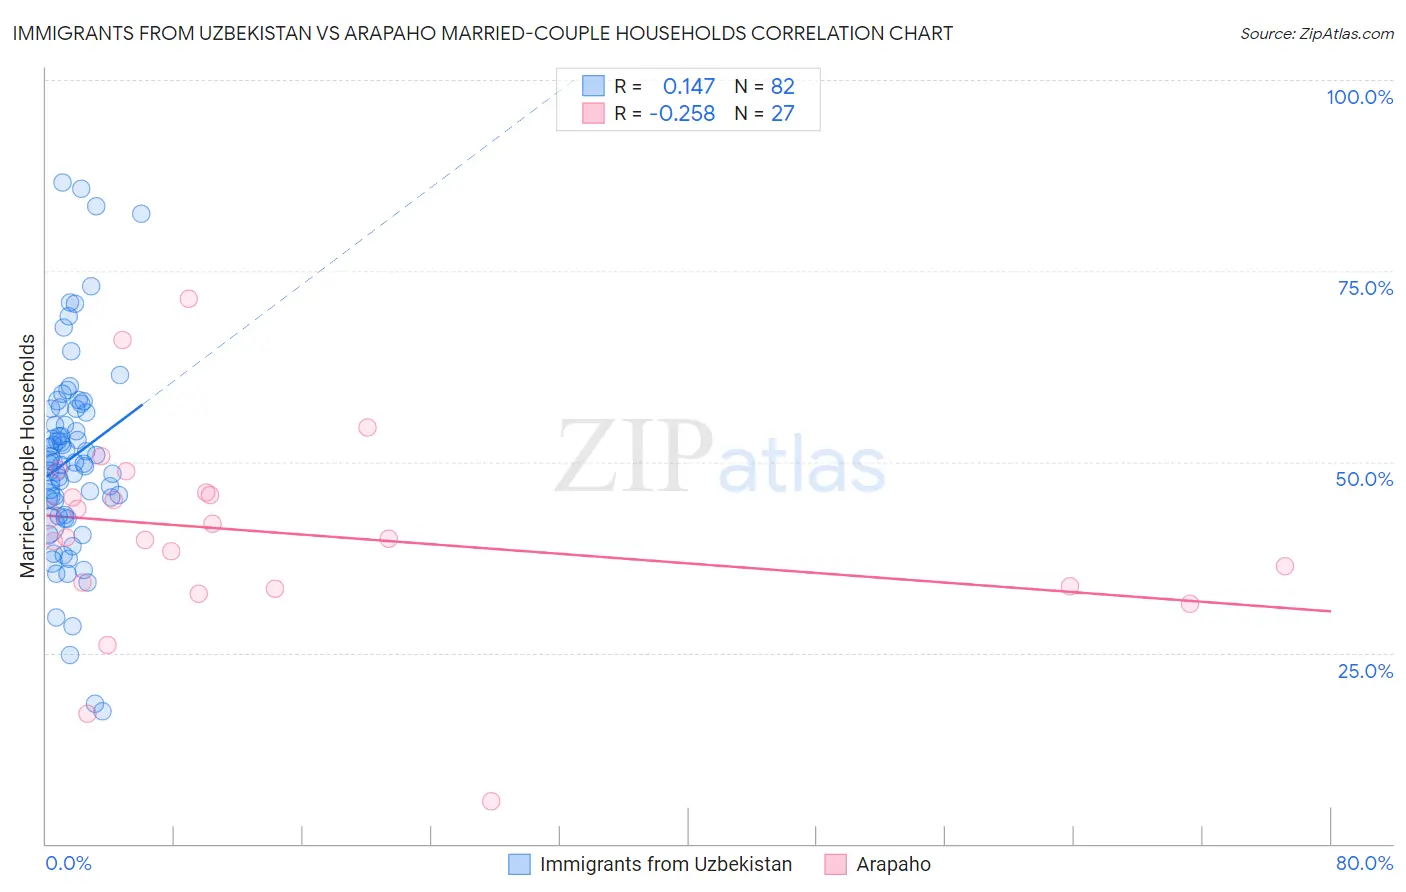
Immigrants from Uzbekistan vs Arapaho Married-couple Households Correlation Chart
The statistical analysis conducted on geographies consisting of 118,716,463 people shows a poor positive correlation between the proportion of Immigrants from Uzbekistan and percentage of married-couple family households in the United States with a correlation coefficient (R) of 0.147 and weighted average of 45.4%. Similarly, the statistical analysis conducted on geographies consisting of 29,778,233 people shows a weak negative correlation between the proportion of Arapaho and percentage of married-couple family households in the United States with a correlation coefficient (R) of -0.258 and weighted average of 41.8%, a difference of 8.6%.
Married-couple Households Correlation Summary
| Measurement | Immigrants from Uzbekistan | Arapaho |
| Minimum | 17.4% | 5.6% |
| Maximum | 86.6% | 71.4% |
| Range | 69.2% | 65.7% |
| Mean | 50.4% | 40.7% |
| Median | 49.8% | 40.1% |
| Interquartile 25% (IQ1) | 43.1% | 33.7% |
| Interquartile 75% (IQ3) | 56.9% | 46.0% |
| Interquartile Range (IQR) | 13.9% | 12.2% |
| Standard Deviation (Sample) | 13.1% | 13.1% |
| Standard Deviation (Population) | 13.0% | 12.8% |
Similar Demographics by Married-couple Households
Demographics Similar to Immigrants from Uzbekistan by Married-couple Households
In terms of married-couple households, the demographic groups most similar to Immigrants from Uzbekistan are Hispanic or Latino (45.4%, a difference of 0.040%), Immigrants from France (45.4%, a difference of 0.050%), Cuban (45.4%, a difference of 0.090%), Immigrants from Spain (45.3%, a difference of 0.14%), and Uruguayan (45.5%, a difference of 0.23%).
| Demographics | Rating | Rank | Married-couple Households |
| Immigrants | Central America | 14.2 /100 | #202 | Poor 45.7% |
| Alaska Natives | 13.0 /100 | #203 | Poor 45.6% |
| Aleuts | 12.5 /100 | #204 | Poor 45.6% |
| Nepalese | 11.9 /100 | #205 | Poor 45.6% |
| Uruguayans | 10.4 /100 | #206 | Poor 45.5% |
| Immigrants | France | 8.8 /100 | #207 | Tragic 45.4% |
| Hispanics or Latinos | 8.7 /100 | #208 | Tragic 45.4% |
| Immigrants | Uzbekistan | 8.4 /100 | #209 | Tragic 45.4% |
| Cubans | 7.7 /100 | #210 | Tragic 45.4% |
| Immigrants | Spain | 7.3 /100 | #211 | Tragic 45.3% |
| Creek | 6.4 /100 | #212 | Tragic 45.3% |
| Yakama | 5.8 /100 | #213 | Tragic 45.2% |
| Japanese | 5.7 /100 | #214 | Tragic 45.2% |
| Immigrants | Nepal | 5.6 /100 | #215 | Tragic 45.2% |
| Immigrants | Portugal | 5.6 /100 | #216 | Tragic 45.2% |
Demographics Similar to Arapaho by Married-couple Households
In terms of married-couple households, the demographic groups most similar to Arapaho are Immigrants from Middle Africa (41.8%, a difference of 0.040%), Immigrants from Ghana (41.8%, a difference of 0.11%), Immigrants from Belize (41.8%, a difference of 0.13%), Immigrants from Sudan (41.9%, a difference of 0.30%), and Immigrants from Bahamas (41.7%, a difference of 0.34%).
| Demographics | Rating | Rank | Married-couple Households |
| Hondurans | 0.0 /100 | #290 | Tragic 42.1% |
| Paiute | 0.0 /100 | #291 | Tragic 42.1% |
| Indonesians | 0.0 /100 | #292 | Tragic 42.0% |
| Menominee | 0.0 /100 | #293 | Tragic 42.0% |
| Immigrants | Yemen | 0.0 /100 | #294 | Tragic 42.0% |
| Kiowa | 0.0 /100 | #295 | Tragic 42.0% |
| Immigrants | Sudan | 0.0 /100 | #296 | Tragic 41.9% |
| Arapaho | 0.0 /100 | #297 | Tragic 41.8% |
| Immigrants | Middle Africa | 0.0 /100 | #298 | Tragic 41.8% |
| Immigrants | Ghana | 0.0 /100 | #299 | Tragic 41.8% |
| Immigrants | Belize | 0.0 /100 | #300 | Tragic 41.8% |
| Immigrants | Bahamas | 0.0 /100 | #301 | Tragic 41.7% |
| Immigrants | Honduras | 0.0 /100 | #302 | Tragic 41.6% |
| Sub-Saharan Africans | 0.0 /100 | #303 | Tragic 41.6% |
| Immigrants | Guyana | 0.0 /100 | #304 | Tragic 41.6% |