Immigrants from North Macedonia vs Arapaho Married-couple Households
COMPARE
Immigrants from North Macedonia
Arapaho
Married-couple Households
Married-couple Households Comparison
Immigrants from North Macedonia
Arapaho
47.9%
MARRIED-COUPLE HOUSEHOLDS
96.4/ 100
METRIC RATING
98th/ 347
METRIC RANK
41.8%
MARRIED-COUPLE HOUSEHOLDS
0.0/ 100
METRIC RATING
297th/ 347
METRIC RANK
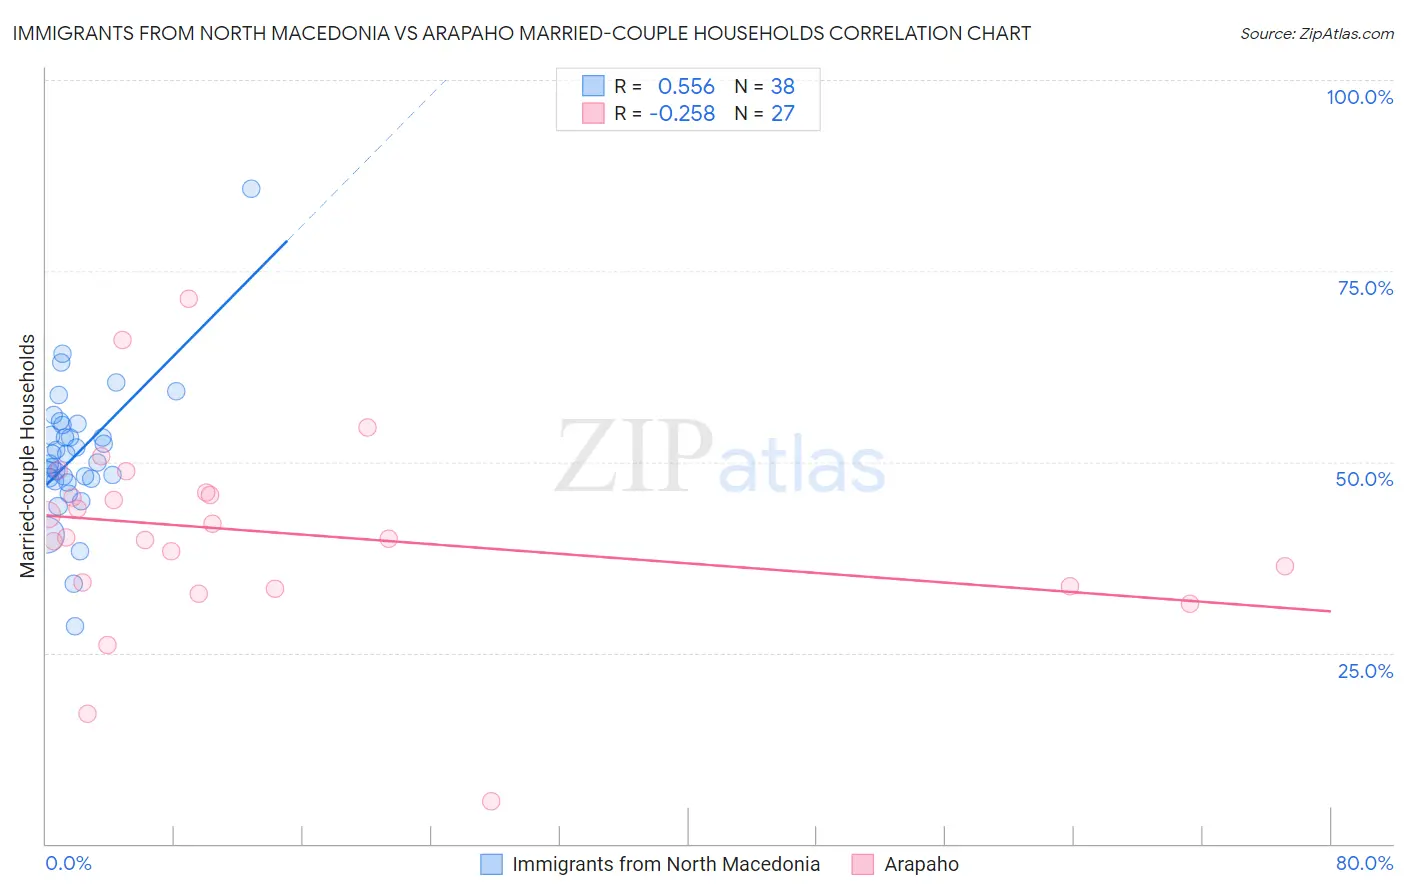
Immigrants from North Macedonia vs Arapaho Married-couple Households Correlation Chart
The statistical analysis conducted on geographies consisting of 74,300,796 people shows a substantial positive correlation between the proportion of Immigrants from North Macedonia and percentage of married-couple family households in the United States with a correlation coefficient (R) of 0.556 and weighted average of 47.9%. Similarly, the statistical analysis conducted on geographies consisting of 29,778,233 people shows a weak negative correlation between the proportion of Arapaho and percentage of married-couple family households in the United States with a correlation coefficient (R) of -0.258 and weighted average of 41.8%, a difference of 14.5%.
Married-couple Households Correlation Summary
| Measurement | Immigrants from North Macedonia | Arapaho |
| Minimum | 28.5% | 5.6% |
| Maximum | 85.7% | 71.4% |
| Range | 57.2% | 65.7% |
| Mean | 51.1% | 40.7% |
| Median | 50.5% | 40.1% |
| Interquartile 25% (IQ1) | 47.9% | 33.7% |
| Interquartile 75% (IQ3) | 54.8% | 46.0% |
| Interquartile Range (IQR) | 6.9% | 12.2% |
| Standard Deviation (Sample) | 9.2% | 13.1% |
| Standard Deviation (Population) | 9.0% | 12.8% |
Similar Demographics by Married-couple Households
Demographics Similar to Immigrants from North Macedonia by Married-couple Households
In terms of married-couple households, the demographic groups most similar to Immigrants from North Macedonia are Latvian (47.9%, a difference of 0.010%), Immigrants from Austria (47.9%, a difference of 0.010%), Immigrants from Italy (47.9%, a difference of 0.020%), Immigrants from Egypt (47.9%, a difference of 0.040%), and Turkish (47.8%, a difference of 0.080%).
| Demographics | Rating | Rank | Married-couple Households |
| Immigrants | Moldova | 97.0 /100 | #91 | Exceptional 48.0% |
| Palestinians | 96.9 /100 | #92 | Exceptional 48.0% |
| Lebanese | 96.9 /100 | #93 | Exceptional 47.9% |
| Americans | 96.9 /100 | #94 | Exceptional 47.9% |
| Immigrants | Belgium | 96.8 /100 | #95 | Exceptional 47.9% |
| Immigrants | Egypt | 96.6 /100 | #96 | Exceptional 47.9% |
| Latvians | 96.5 /100 | #97 | Exceptional 47.9% |
| Immigrants | North Macedonia | 96.4 /100 | #98 | Exceptional 47.9% |
| Immigrants | Austria | 96.4 /100 | #99 | Exceptional 47.9% |
| Immigrants | Italy | 96.3 /100 | #100 | Exceptional 47.9% |
| Turks | 96.1 /100 | #101 | Exceptional 47.8% |
| Slavs | 96.0 /100 | #102 | Exceptional 47.8% |
| Hawaiians | 96.0 /100 | #103 | Exceptional 47.8% |
| Immigrants | South Africa | 96.0 /100 | #104 | Exceptional 47.8% |
| Immigrants | Czechoslovakia | 95.5 /100 | #105 | Exceptional 47.8% |
Demographics Similar to Arapaho by Married-couple Households
In terms of married-couple households, the demographic groups most similar to Arapaho are Immigrants from Middle Africa (41.8%, a difference of 0.040%), Immigrants from Ghana (41.8%, a difference of 0.11%), Immigrants from Belize (41.8%, a difference of 0.13%), Immigrants from Sudan (41.9%, a difference of 0.30%), and Immigrants from Bahamas (41.7%, a difference of 0.34%).
| Demographics | Rating | Rank | Married-couple Households |
| Hondurans | 0.0 /100 | #290 | Tragic 42.1% |
| Paiute | 0.0 /100 | #291 | Tragic 42.1% |
| Indonesians | 0.0 /100 | #292 | Tragic 42.0% |
| Menominee | 0.0 /100 | #293 | Tragic 42.0% |
| Immigrants | Yemen | 0.0 /100 | #294 | Tragic 42.0% |
| Kiowa | 0.0 /100 | #295 | Tragic 42.0% |
| Immigrants | Sudan | 0.0 /100 | #296 | Tragic 41.9% |
| Arapaho | 0.0 /100 | #297 | Tragic 41.8% |
| Immigrants | Middle Africa | 0.0 /100 | #298 | Tragic 41.8% |
| Immigrants | Ghana | 0.0 /100 | #299 | Tragic 41.8% |
| Immigrants | Belize | 0.0 /100 | #300 | Tragic 41.8% |
| Immigrants | Bahamas | 0.0 /100 | #301 | Tragic 41.7% |
| Immigrants | Honduras | 0.0 /100 | #302 | Tragic 41.6% |
| Sub-Saharan Africans | 0.0 /100 | #303 | Tragic 41.6% |
| Immigrants | Guyana | 0.0 /100 | #304 | Tragic 41.6% |