Immigrants from Uzbekistan vs Ute Married-couple Households
COMPARE
Immigrants from Uzbekistan
Ute
Married-couple Households
Married-couple Households Comparison
Immigrants from Uzbekistan
Ute
45.4%
MARRIED-COUPLE HOUSEHOLDS
8.4/ 100
METRIC RATING
209th/ 347
METRIC RANK
44.4%
MARRIED-COUPLE HOUSEHOLDS
1.0/ 100
METRIC RATING
240th/ 347
METRIC RANK
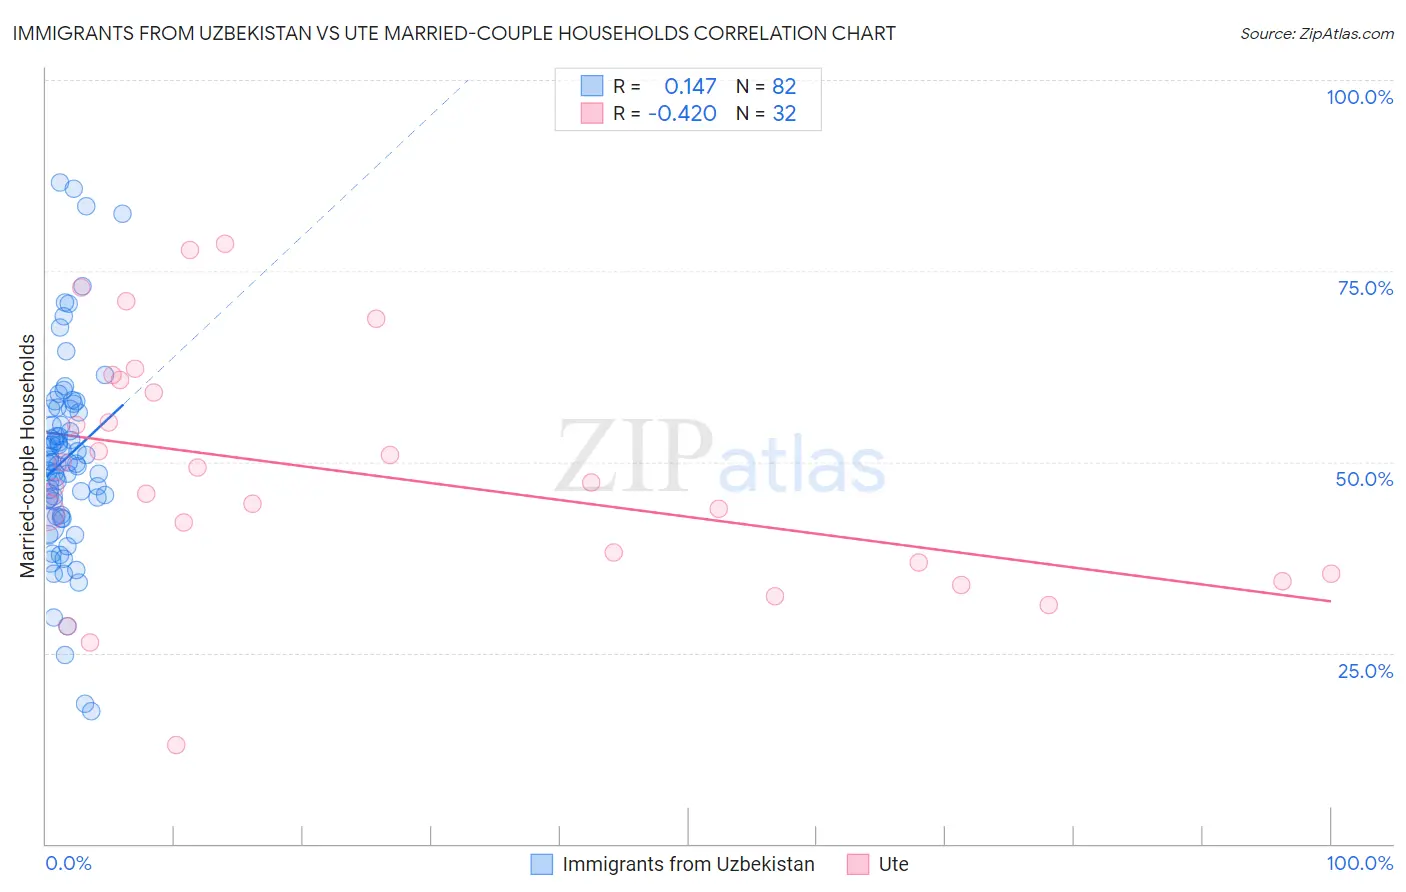
Immigrants from Uzbekistan vs Ute Married-couple Households Correlation Chart
The statistical analysis conducted on geographies consisting of 118,716,463 people shows a poor positive correlation between the proportion of Immigrants from Uzbekistan and percentage of married-couple family households in the United States with a correlation coefficient (R) of 0.147 and weighted average of 45.4%. Similarly, the statistical analysis conducted on geographies consisting of 55,658,636 people shows a moderate negative correlation between the proportion of Ute and percentage of married-couple family households in the United States with a correlation coefficient (R) of -0.420 and weighted average of 44.4%, a difference of 2.1%.
Married-couple Households Correlation Summary
| Measurement | Immigrants from Uzbekistan | Ute |
| Minimum | 17.4% | 12.9% |
| Maximum | 86.6% | 78.5% |
| Range | 69.2% | 65.6% |
| Mean | 50.4% | 48.4% |
| Median | 49.8% | 47.0% |
| Interquartile 25% (IQ1) | 43.1% | 36.1% |
| Interquartile 75% (IQ3) | 56.9% | 59.9% |
| Interquartile Range (IQR) | 13.9% | 23.8% |
| Standard Deviation (Sample) | 13.1% | 15.7% |
| Standard Deviation (Population) | 13.0% | 15.5% |
Similar Demographics by Married-couple Households
Demographics Similar to Immigrants from Uzbekistan by Married-couple Households
In terms of married-couple households, the demographic groups most similar to Immigrants from Uzbekistan are Hispanic or Latino (45.4%, a difference of 0.040%), Immigrants from France (45.4%, a difference of 0.050%), Cuban (45.4%, a difference of 0.090%), Immigrants from Spain (45.3%, a difference of 0.14%), and Uruguayan (45.5%, a difference of 0.23%).
| Demographics | Rating | Rank | Married-couple Households |
| Immigrants | Central America | 14.2 /100 | #202 | Poor 45.7% |
| Alaska Natives | 13.0 /100 | #203 | Poor 45.6% |
| Aleuts | 12.5 /100 | #204 | Poor 45.6% |
| Nepalese | 11.9 /100 | #205 | Poor 45.6% |
| Uruguayans | 10.4 /100 | #206 | Poor 45.5% |
| Immigrants | France | 8.8 /100 | #207 | Tragic 45.4% |
| Hispanics or Latinos | 8.7 /100 | #208 | Tragic 45.4% |
| Immigrants | Uzbekistan | 8.4 /100 | #209 | Tragic 45.4% |
| Cubans | 7.7 /100 | #210 | Tragic 45.4% |
| Immigrants | Spain | 7.3 /100 | #211 | Tragic 45.3% |
| Creek | 6.4 /100 | #212 | Tragic 45.3% |
| Yakama | 5.8 /100 | #213 | Tragic 45.2% |
| Japanese | 5.7 /100 | #214 | Tragic 45.2% |
| Immigrants | Nepal | 5.6 /100 | #215 | Tragic 45.2% |
| Immigrants | Portugal | 5.6 /100 | #216 | Tragic 45.2% |
Demographics Similar to Ute by Married-couple Households
In terms of married-couple households, the demographic groups most similar to Ute are Immigrants from Bosnia and Herzegovina (44.4%, a difference of 0.0%), Immigrants from Albania (44.4%, a difference of 0.040%), Spanish American (44.5%, a difference of 0.080%), Immigrants from Uruguay (44.5%, a difference of 0.10%), and Immigrants from Saudi Arabia (44.4%, a difference of 0.11%).
| Demographics | Rating | Rank | Married-couple Households |
| Immigrants | Uganda | 1.5 /100 | #233 | Tragic 44.6% |
| Immigrants | Panama | 1.3 /100 | #234 | Tragic 44.6% |
| Immigrants | Nicaragua | 1.2 /100 | #235 | Tragic 44.5% |
| Yaqui | 1.2 /100 | #236 | Tragic 44.5% |
| Comanche | 1.2 /100 | #237 | Tragic 44.5% |
| Immigrants | Uruguay | 1.1 /100 | #238 | Tragic 44.5% |
| Spanish Americans | 1.1 /100 | #239 | Tragic 44.5% |
| Ute | 1.0 /100 | #240 | Tragic 44.4% |
| Immigrants | Bosnia and Herzegovina | 1.0 /100 | #241 | Tragic 44.4% |
| Immigrants | Albania | 1.0 /100 | #242 | Tragic 44.4% |
| Immigrants | Saudi Arabia | 0.9 /100 | #243 | Tragic 44.4% |
| Immigrants | Armenia | 0.7 /100 | #244 | Tragic 44.3% |
| Immigrants | El Salvador | 0.7 /100 | #245 | Tragic 44.3% |
| Immigrants | Cuba | 0.6 /100 | #246 | Tragic 44.2% |
| Immigrants | Morocco | 0.6 /100 | #247 | Tragic 44.2% |