Immigrants from Uzbekistan vs Arapaho Median Earnings
COMPARE
Immigrants from Uzbekistan
Arapaho
Median Earnings
Median Earnings Comparison
Immigrants from Uzbekistan
Arapaho
$50,151
MEDIAN EARNINGS
99.5/ 100
METRIC RATING
87th/ 347
METRIC RANK
$36,586
MEDIAN EARNINGS
0.0/ 100
METRIC RATING
344th/ 347
METRIC RANK
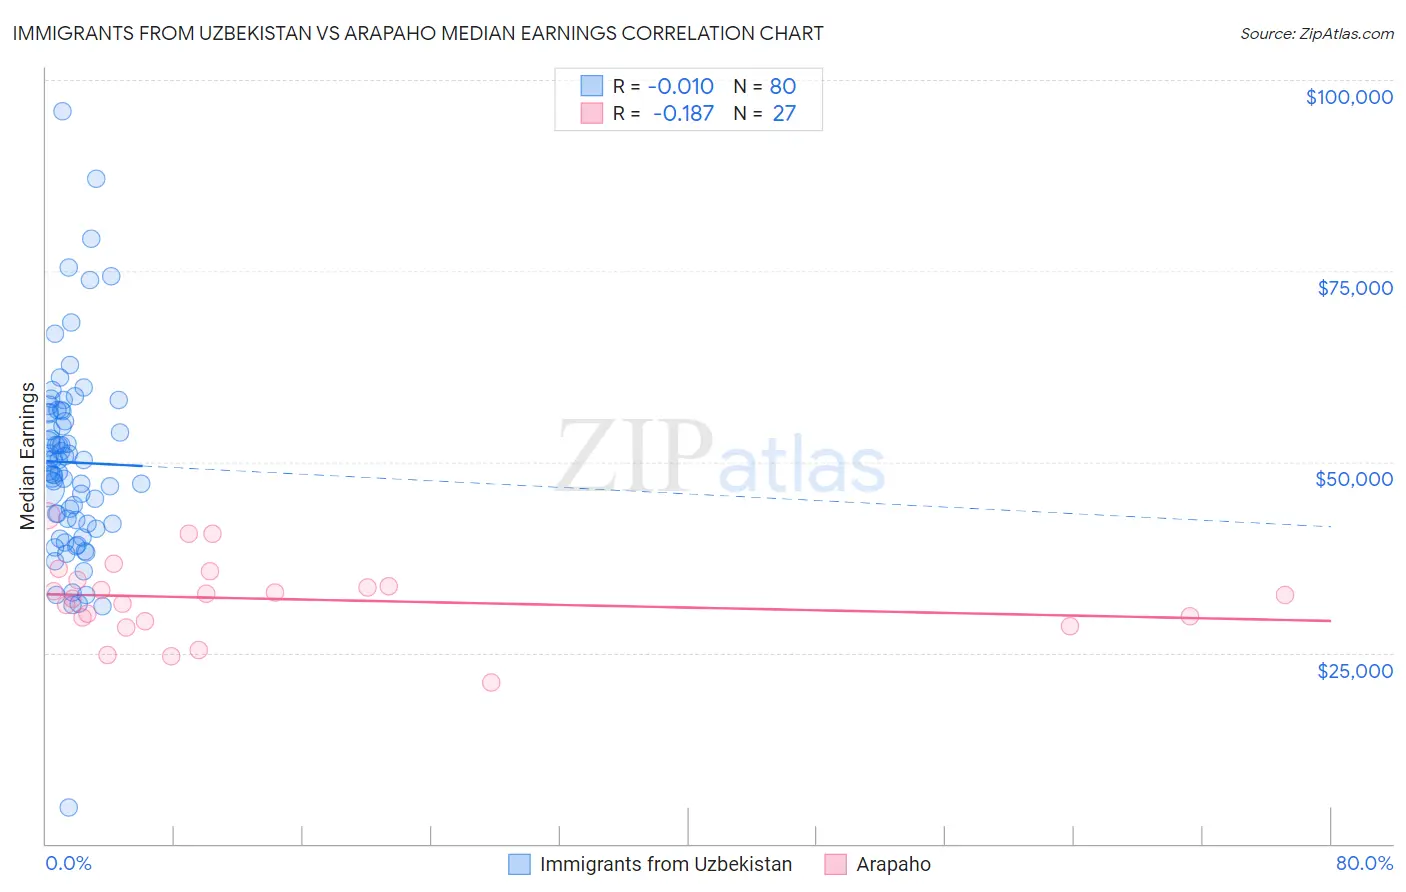
Immigrants from Uzbekistan vs Arapaho Median Earnings Correlation Chart
The statistical analysis conducted on geographies consisting of 118,764,980 people shows no correlation between the proportion of Immigrants from Uzbekistan and median earnings in the United States with a correlation coefficient (R) of -0.010 and weighted average of $50,151. Similarly, the statistical analysis conducted on geographies consisting of 29,778,965 people shows a poor negative correlation between the proportion of Arapaho and median earnings in the United States with a correlation coefficient (R) of -0.187 and weighted average of $36,586, a difference of 37.1%.
Median Earnings Correlation Summary
| Measurement | Immigrants from Uzbekistan | Arapaho |
| Minimum | $4,716 | $21,094 |
| Maximum | $95,833 | $42,957 |
| Range | $91,117 | $21,863 |
| Mean | $49,941 | $32,041 |
| Median | $49,455 | $32,563 |
| Interquartile 25% (IQ1) | $41,888 | $29,178 |
| Interquartile 75% (IQ3) | $56,559 | $34,586 |
| Interquartile Range (IQR) | $14,671 | $5,408 |
| Standard Deviation (Sample) | $13,280 | $5,015 |
| Standard Deviation (Population) | $13,197 | $4,921 |
Similar Demographics by Median Earnings
Demographics Similar to Immigrants from Uzbekistan by Median Earnings
In terms of median earnings, the demographic groups most similar to Immigrants from Uzbekistan are Albanian ($50,116, a difference of 0.070%), Immigrants from Canada ($50,192, a difference of 0.080%), Immigrants from North America ($50,108, a difference of 0.090%), Immigrants from Hungary ($50,227, a difference of 0.15%), and Immigrants from Kazakhstan ($50,225, a difference of 0.15%).
| Demographics | Rating | Rank | Median Earnings |
| Ukrainians | 99.6 /100 | #80 | Exceptional $50,320 |
| Immigrants | Southern Europe | 99.6 /100 | #81 | Exceptional $50,280 |
| Immigrants | Moldova | 99.5 /100 | #82 | Exceptional $50,274 |
| Romanians | 99.5 /100 | #83 | Exceptional $50,244 |
| Immigrants | Hungary | 99.5 /100 | #84 | Exceptional $50,227 |
| Immigrants | Kazakhstan | 99.5 /100 | #85 | Exceptional $50,225 |
| Immigrants | Canada | 99.5 /100 | #86 | Exceptional $50,192 |
| Immigrants | Uzbekistan | 99.5 /100 | #87 | Exceptional $50,151 |
| Albanians | 99.4 /100 | #88 | Exceptional $50,116 |
| Immigrants | North America | 99.4 /100 | #89 | Exceptional $50,108 |
| Italians | 99.3 /100 | #90 | Exceptional $49,915 |
| Macedonians | 99.2 /100 | #91 | Exceptional $49,893 |
| Immigrants | Argentina | 99.2 /100 | #92 | Exceptional $49,841 |
| Armenians | 99.1 /100 | #93 | Exceptional $49,804 |
| Croatians | 99.0 /100 | #94 | Exceptional $49,724 |
Demographics Similar to Arapaho by Median Earnings
In terms of median earnings, the demographic groups most similar to Arapaho are Tohono O'odham ($36,349, a difference of 0.65%), Pueblo ($36,859, a difference of 0.75%), Hopi ($36,871, a difference of 0.78%), Lumbee ($36,876, a difference of 0.79%), and Navajo ($36,999, a difference of 1.1%).
| Demographics | Rating | Rank | Median Earnings |
| Houma | 0.0 /100 | #333 | Tragic $38,949 |
| Spanish American Indians | 0.0 /100 | #334 | Tragic $38,907 |
| Natives/Alaskans | 0.0 /100 | #335 | Tragic $38,896 |
| Crow | 0.0 /100 | #336 | Tragic $38,707 |
| Immigrants | Cuba | 0.0 /100 | #337 | Tragic $38,426 |
| Pima | 0.0 /100 | #338 | Tragic $38,285 |
| Menominee | 0.0 /100 | #339 | Tragic $37,884 |
| Navajo | 0.0 /100 | #340 | Tragic $36,999 |
| Lumbee | 0.0 /100 | #341 | Tragic $36,876 |
| Hopi | 0.0 /100 | #342 | Tragic $36,871 |
| Pueblo | 0.0 /100 | #343 | Tragic $36,859 |
| Arapaho | 0.0 /100 | #344 | Tragic $36,586 |
| Tohono O'odham | 0.0 /100 | #345 | Tragic $36,349 |
| Yup'ik | 0.0 /100 | #346 | Tragic $35,942 |
| Puerto Ricans | 0.0 /100 | #347 | Tragic $35,560 |