Tohono O'odham vs Arapaho Married-couple Households
COMPARE
Tohono O'odham
Arapaho
Married-couple Households
Married-couple Households Comparison
Tohono O'odham
Arapaho
37.9%
MARRIED-COUPLE HOUSEHOLDS
0.0/ 100
METRIC RATING
342nd/ 347
METRIC RANK
41.8%
MARRIED-COUPLE HOUSEHOLDS
0.0/ 100
METRIC RATING
297th/ 347
METRIC RANK
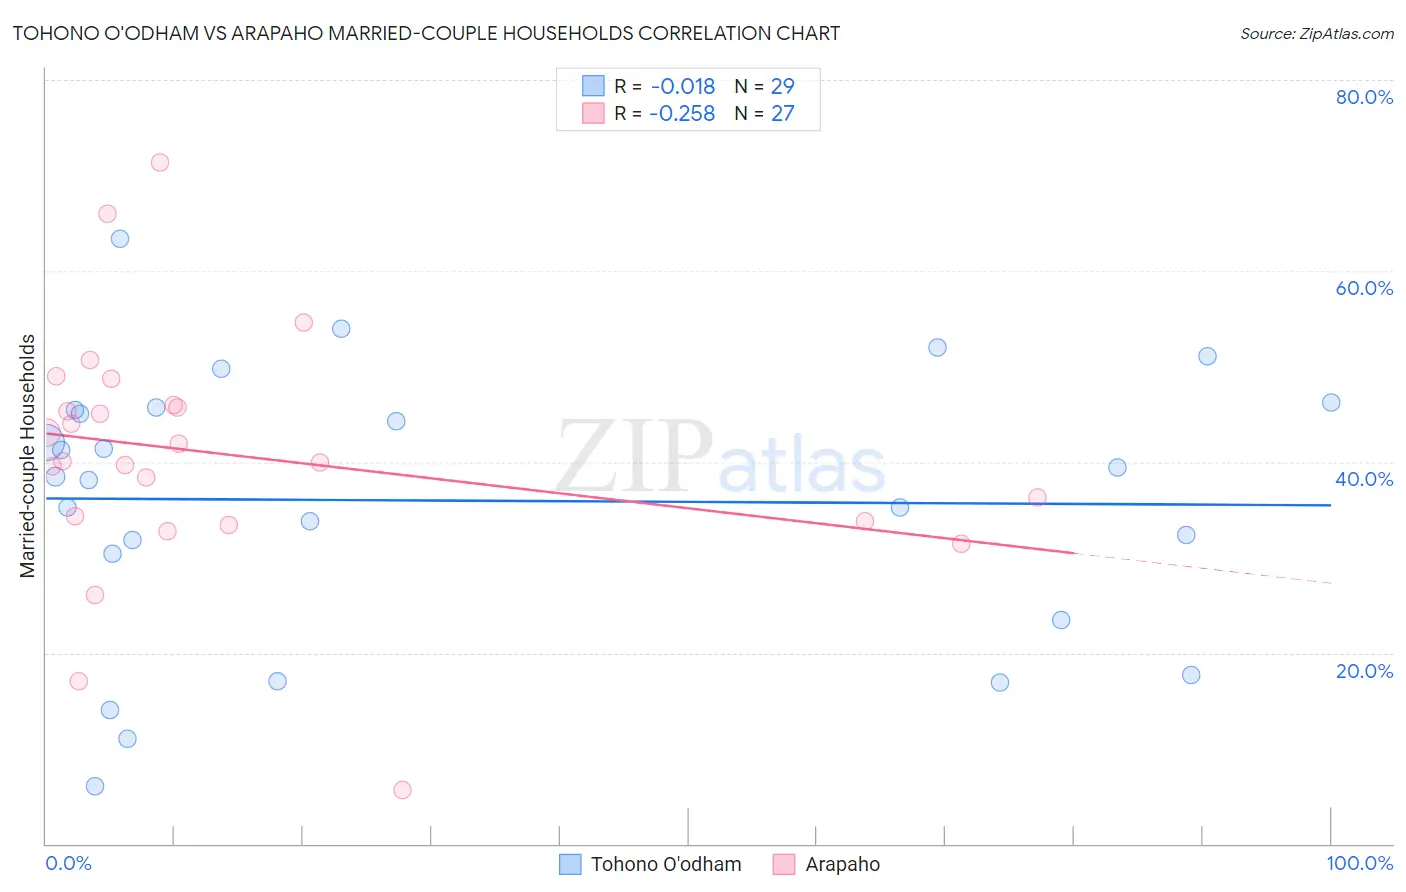
Tohono O'odham vs Arapaho Married-couple Households Correlation Chart
The statistical analysis conducted on geographies consisting of 58,718,357 people shows no correlation between the proportion of Tohono O'odham and percentage of married-couple family households in the United States with a correlation coefficient (R) of -0.018 and weighted average of 37.9%. Similarly, the statistical analysis conducted on geographies consisting of 29,778,233 people shows a weak negative correlation between the proportion of Arapaho and percentage of married-couple family households in the United States with a correlation coefficient (R) of -0.258 and weighted average of 41.8%, a difference of 10.3%.
Married-couple Households Correlation Summary
| Measurement | Tohono O'odham | Arapaho |
| Minimum | 6.1% | 5.6% |
| Maximum | 63.4% | 71.4% |
| Range | 57.3% | 65.7% |
| Mean | 35.9% | 40.7% |
| Median | 38.5% | 40.1% |
| Interquartile 25% (IQ1) | 26.9% | 33.7% |
| Interquartile 75% (IQ3) | 45.6% | 46.0% |
| Interquartile Range (IQR) | 18.7% | 12.2% |
| Standard Deviation (Sample) | 14.1% | 13.1% |
| Standard Deviation (Population) | 13.9% | 12.8% |
Similar Demographics by Married-couple Households
Demographics Similar to Tohono O'odham by Married-couple Households
In terms of married-couple households, the demographic groups most similar to Tohono O'odham are Cape Verdean (38.1%, a difference of 0.60%), Dominican (38.2%, a difference of 0.73%), Immigrants from Grenada (37.5%, a difference of 1.1%), British West Indian (38.3%, a difference of 1.1%), and Immigrants from Senegal (38.4%, a difference of 1.2%).
| Demographics | Rating | Rank | Married-couple Households |
| Immigrants | West Indies | 0.0 /100 | #333 | Tragic 39.0% |
| Immigrants | St. Vincent and the Grenadines | 0.0 /100 | #334 | Tragic 38.7% |
| Senegalese | 0.0 /100 | #335 | Tragic 38.6% |
| Blacks/African Americans | 0.0 /100 | #336 | Tragic 38.5% |
| Immigrants | Somalia | 0.0 /100 | #337 | Tragic 38.4% |
| Immigrants | Senegal | 0.0 /100 | #338 | Tragic 38.4% |
| British West Indians | 0.0 /100 | #339 | Tragic 38.3% |
| Dominicans | 0.0 /100 | #340 | Tragic 38.2% |
| Cape Verdeans | 0.0 /100 | #341 | Tragic 38.1% |
| Tohono O'odham | 0.0 /100 | #342 | Tragic 37.9% |
| Immigrants | Grenada | 0.0 /100 | #343 | Tragic 37.5% |
| Immigrants | Dominican Republic | 0.0 /100 | #344 | Tragic 37.3% |
| Hopi | 0.0 /100 | #345 | Tragic 36.7% |
| Immigrants | Cabo Verde | 0.0 /100 | #346 | Tragic 36.2% |
| Pima | 0.0 /100 | #347 | Tragic 35.6% |
Demographics Similar to Arapaho by Married-couple Households
In terms of married-couple households, the demographic groups most similar to Arapaho are Immigrants from Middle Africa (41.8%, a difference of 0.040%), Immigrants from Ghana (41.8%, a difference of 0.11%), Immigrants from Belize (41.8%, a difference of 0.13%), Immigrants from Sudan (41.9%, a difference of 0.30%), and Immigrants from Bahamas (41.7%, a difference of 0.34%).
| Demographics | Rating | Rank | Married-couple Households |
| Hondurans | 0.0 /100 | #290 | Tragic 42.1% |
| Paiute | 0.0 /100 | #291 | Tragic 42.1% |
| Indonesians | 0.0 /100 | #292 | Tragic 42.0% |
| Menominee | 0.0 /100 | #293 | Tragic 42.0% |
| Immigrants | Yemen | 0.0 /100 | #294 | Tragic 42.0% |
| Kiowa | 0.0 /100 | #295 | Tragic 42.0% |
| Immigrants | Sudan | 0.0 /100 | #296 | Tragic 41.9% |
| Arapaho | 0.0 /100 | #297 | Tragic 41.8% |
| Immigrants | Middle Africa | 0.0 /100 | #298 | Tragic 41.8% |
| Immigrants | Ghana | 0.0 /100 | #299 | Tragic 41.8% |
| Immigrants | Belize | 0.0 /100 | #300 | Tragic 41.8% |
| Immigrants | Bahamas | 0.0 /100 | #301 | Tragic 41.7% |
| Immigrants | Honduras | 0.0 /100 | #302 | Tragic 41.6% |
| Sub-Saharan Africans | 0.0 /100 | #303 | Tragic 41.6% |
| Immigrants | Guyana | 0.0 /100 | #304 | Tragic 41.6% |