Immigrants from Uzbekistan vs Immigrants from Congo Married-couple Households
COMPARE
Immigrants from Uzbekistan
Immigrants from Congo
Married-couple Households
Married-couple Households Comparison
Immigrants from Uzbekistan
Immigrants from Congo
45.4%
MARRIED-COUPLE HOUSEHOLDS
8.4/ 100
METRIC RATING
209th/ 347
METRIC RANK
39.0%
MARRIED-COUPLE HOUSEHOLDS
0.0/ 100
METRIC RATING
331st/ 347
METRIC RANK
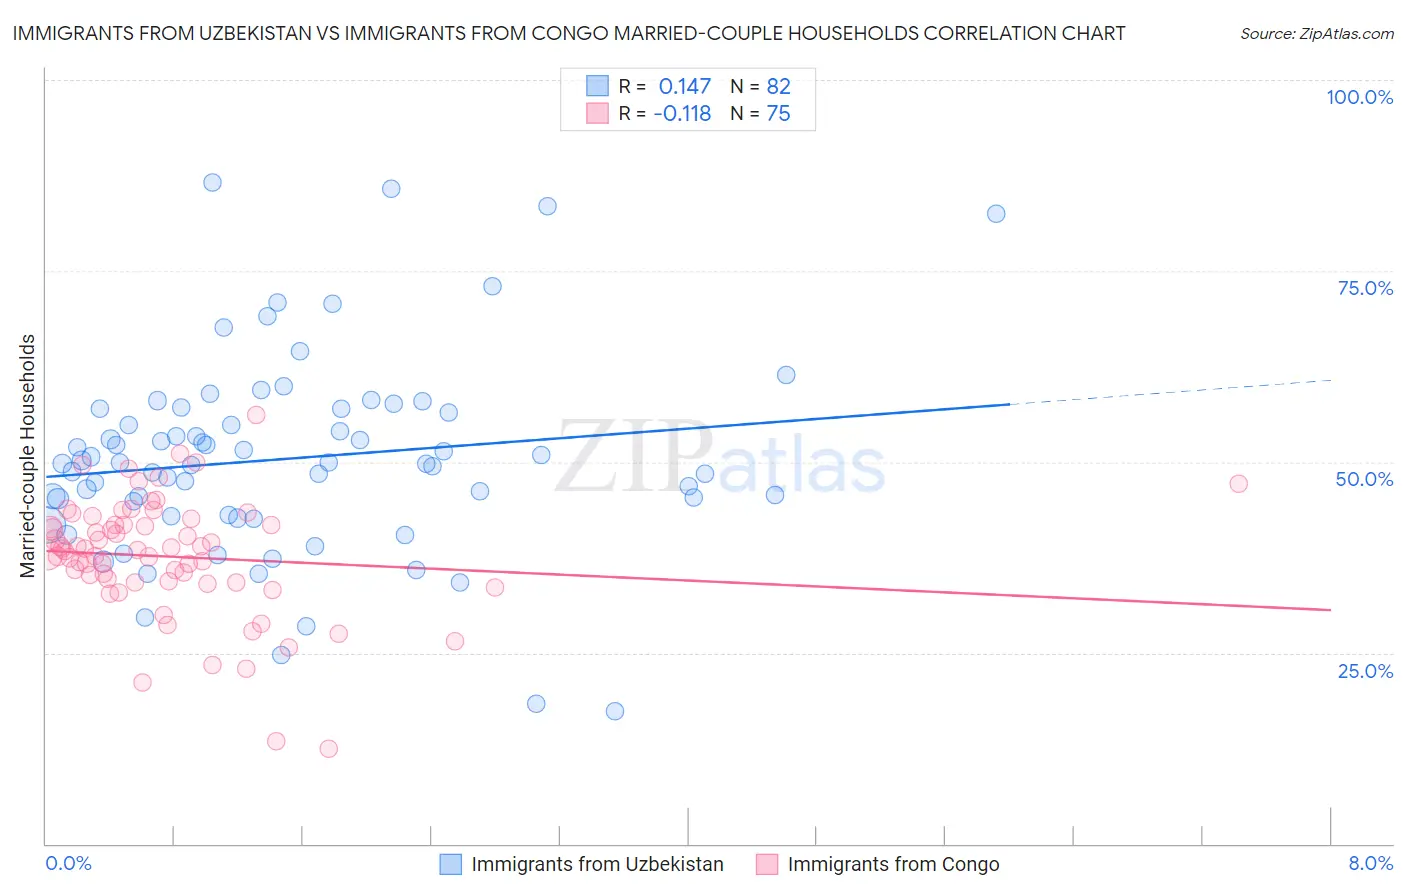
Immigrants from Uzbekistan vs Immigrants from Congo Married-couple Households Correlation Chart
The statistical analysis conducted on geographies consisting of 118,716,463 people shows a poor positive correlation between the proportion of Immigrants from Uzbekistan and percentage of married-couple family households in the United States with a correlation coefficient (R) of 0.147 and weighted average of 45.4%. Similarly, the statistical analysis conducted on geographies consisting of 92,079,581 people shows a poor negative correlation between the proportion of Immigrants from Congo and percentage of married-couple family households in the United States with a correlation coefficient (R) of -0.118 and weighted average of 39.0%, a difference of 16.3%.
Married-couple Households Correlation Summary
| Measurement | Immigrants from Uzbekistan | Immigrants from Congo |
| Minimum | 17.4% | 12.4% |
| Maximum | 86.6% | 56.2% |
| Range | 69.2% | 43.8% |
| Mean | 50.4% | 37.6% |
| Median | 49.8% | 38.4% |
| Interquartile 25% (IQ1) | 43.1% | 34.2% |
| Interquartile 75% (IQ3) | 56.9% | 41.7% |
| Interquartile Range (IQR) | 13.9% | 7.5% |
| Standard Deviation (Sample) | 13.1% | 7.8% |
| Standard Deviation (Population) | 13.0% | 7.8% |
Similar Demographics by Married-couple Households
Demographics Similar to Immigrants from Uzbekistan by Married-couple Households
In terms of married-couple households, the demographic groups most similar to Immigrants from Uzbekistan are Hispanic or Latino (45.4%, a difference of 0.040%), Immigrants from France (45.4%, a difference of 0.050%), Cuban (45.4%, a difference of 0.090%), Immigrants from Spain (45.3%, a difference of 0.14%), and Uruguayan (45.5%, a difference of 0.23%).
| Demographics | Rating | Rank | Married-couple Households |
| Immigrants | Central America | 14.2 /100 | #202 | Poor 45.7% |
| Alaska Natives | 13.0 /100 | #203 | Poor 45.6% |
| Aleuts | 12.5 /100 | #204 | Poor 45.6% |
| Nepalese | 11.9 /100 | #205 | Poor 45.6% |
| Uruguayans | 10.4 /100 | #206 | Poor 45.5% |
| Immigrants | France | 8.8 /100 | #207 | Tragic 45.4% |
| Hispanics or Latinos | 8.7 /100 | #208 | Tragic 45.4% |
| Immigrants | Uzbekistan | 8.4 /100 | #209 | Tragic 45.4% |
| Cubans | 7.7 /100 | #210 | Tragic 45.4% |
| Immigrants | Spain | 7.3 /100 | #211 | Tragic 45.3% |
| Creek | 6.4 /100 | #212 | Tragic 45.3% |
| Yakama | 5.8 /100 | #213 | Tragic 45.2% |
| Japanese | 5.7 /100 | #214 | Tragic 45.2% |
| Immigrants | Nepal | 5.6 /100 | #215 | Tragic 45.2% |
| Immigrants | Portugal | 5.6 /100 | #216 | Tragic 45.2% |
Demographics Similar to Immigrants from Congo by Married-couple Households
In terms of married-couple households, the demographic groups most similar to Immigrants from Congo are Somali (39.0%, a difference of 0.090%), Immigrants from West Indies (39.0%, a difference of 0.12%), Immigrants from Barbados (39.2%, a difference of 0.44%), Immigrants from Dominica (39.4%, a difference of 0.88%), and Immigrants from St. Vincent and the Grenadines (38.7%, a difference of 0.90%).
| Demographics | Rating | Rank | Married-couple Households |
| Navajo | 0.0 /100 | #324 | Tragic 40.1% |
| Pueblo | 0.0 /100 | #325 | Tragic 40.0% |
| U.S. Virgin Islanders | 0.0 /100 | #326 | Tragic 39.8% |
| Lumbee | 0.0 /100 | #327 | Tragic 39.6% |
| Barbadians | 0.0 /100 | #328 | Tragic 39.4% |
| Immigrants | Dominica | 0.0 /100 | #329 | Tragic 39.4% |
| Immigrants | Barbados | 0.0 /100 | #330 | Tragic 39.2% |
| Immigrants | Congo | 0.0 /100 | #331 | Tragic 39.0% |
| Somalis | 0.0 /100 | #332 | Tragic 39.0% |
| Immigrants | West Indies | 0.0 /100 | #333 | Tragic 39.0% |
| Immigrants | St. Vincent and the Grenadines | 0.0 /100 | #334 | Tragic 38.7% |
| Senegalese | 0.0 /100 | #335 | Tragic 38.6% |
| Blacks/African Americans | 0.0 /100 | #336 | Tragic 38.5% |
| Immigrants | Somalia | 0.0 /100 | #337 | Tragic 38.4% |
| Immigrants | Senegal | 0.0 /100 | #338 | Tragic 38.4% |