Immigrants from Trinidad and Tobago vs Apache Female Poverty Among 18-24 Year Olds
COMPARE
Immigrants from Trinidad and Tobago
Apache
Female Poverty Among 18-24 Year Olds
Female Poverty Among 18-24 Year Olds Comparison
Immigrants from Trinidad and Tobago
Apache
19.7%
FEMALE POVERTY AMONG 18-24 YEAR OLDS
85.6/ 100
METRIC RATING
140th/ 347
METRIC RANK
26.3%
FEMALE POVERTY AMONG 18-24 YEAR OLDS
0.0/ 100
METRIC RATING
333rd/ 347
METRIC RANK
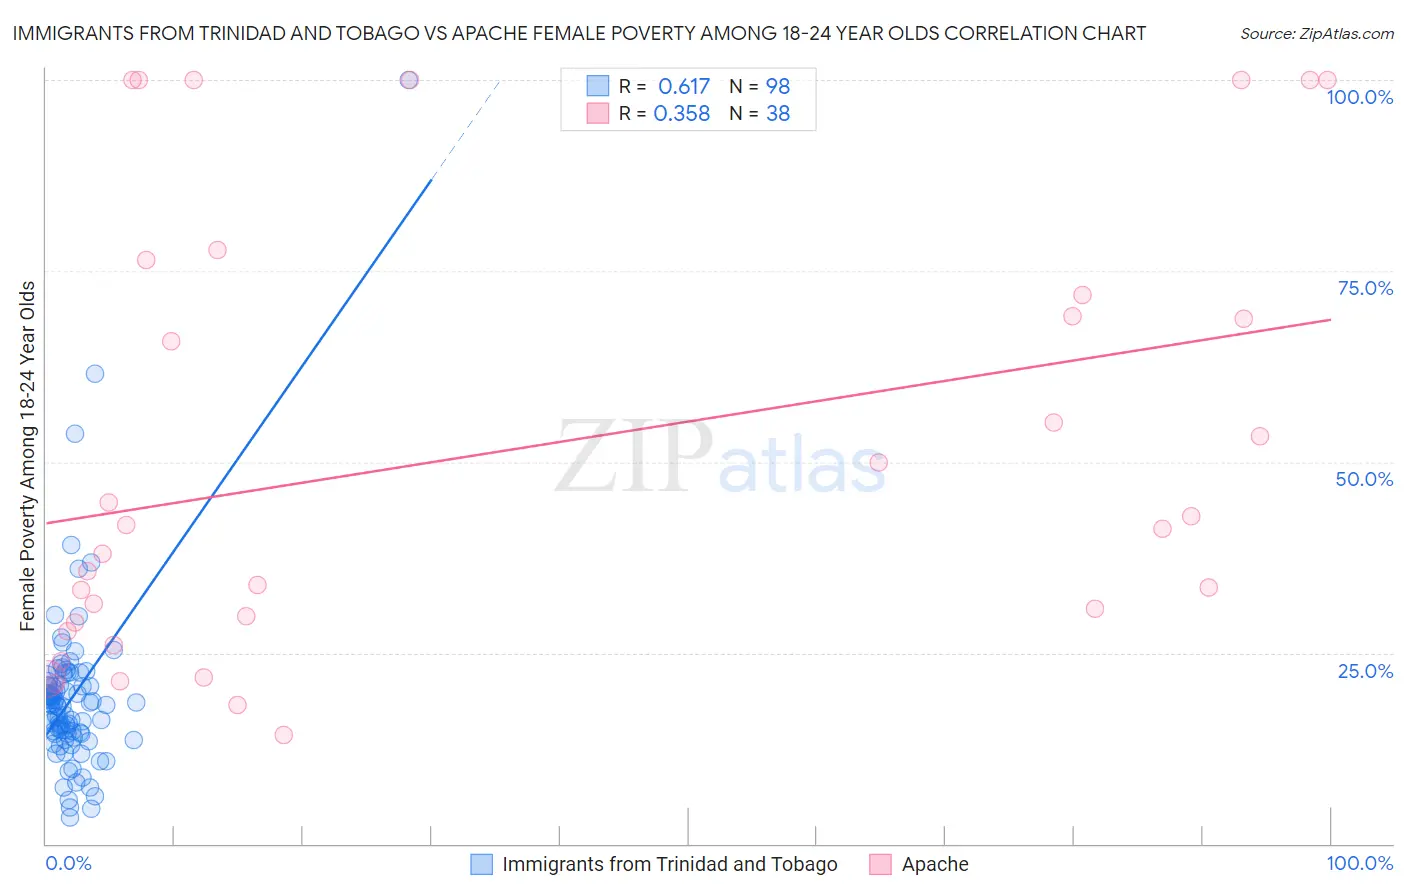
Immigrants from Trinidad and Tobago vs Apache Female Poverty Among 18-24 Year Olds Correlation Chart
The statistical analysis conducted on geographies consisting of 219,818,736 people shows a significant positive correlation between the proportion of Immigrants from Trinidad and Tobago and poverty level among females between the ages 18 and 24 in the United States with a correlation coefficient (R) of 0.617 and weighted average of 19.7%. Similarly, the statistical analysis conducted on geographies consisting of 228,623,137 people shows a mild positive correlation between the proportion of Apache and poverty level among females between the ages 18 and 24 in the United States with a correlation coefficient (R) of 0.358 and weighted average of 26.3%, a difference of 33.9%.
Female Poverty Among 18-24 Year Olds Correlation Summary
| Measurement | Immigrants from Trinidad and Tobago | Apache |
| Minimum | 3.4% | 14.3% |
| Maximum | 100.0% | 100.0% |
| Range | 96.6% | 85.7% |
| Mean | 19.3% | 51.3% |
| Median | 18.2% | 41.5% |
| Interquartile 25% (IQ1) | 14.4% | 28.9% |
| Interquartile 75% (IQ3) | 20.7% | 71.9% |
| Interquartile Range (IQR) | 6.4% | 42.9% |
| Standard Deviation (Sample) | 11.9% | 28.8% |
| Standard Deviation (Population) | 11.8% | 28.4% |
Similar Demographics by Female Poverty Among 18-24 Year Olds
Demographics Similar to Immigrants from Trinidad and Tobago by Female Poverty Among 18-24 Year Olds
In terms of female poverty among 18-24 year olds, the demographic groups most similar to Immigrants from Trinidad and Tobago are Pennsylvania German (19.7%, a difference of 0.010%), Panamanian (19.7%, a difference of 0.11%), Slavic (19.7%, a difference of 0.12%), Immigrants from Northern Africa (19.7%, a difference of 0.15%), and Canadian (19.7%, a difference of 0.18%).
| Demographics | Rating | Rank | Female Poverty Among 18-24 Year Olds |
| Turks | 92.1 /100 | #133 | Exceptional 19.5% |
| Immigrants | North America | 92.1 /100 | #134 | Exceptional 19.5% |
| Soviet Union | 92.0 /100 | #135 | Exceptional 19.5% |
| Russians | 91.5 /100 | #136 | Exceptional 19.5% |
| Austrians | 90.7 /100 | #137 | Exceptional 19.5% |
| Immigrants | Morocco | 89.9 /100 | #138 | Excellent 19.6% |
| Indians (Asian) | 88.3 /100 | #139 | Excellent 19.6% |
| Immigrants | Trinidad and Tobago | 85.6 /100 | #140 | Excellent 19.7% |
| Pennsylvania Germans | 85.5 /100 | #141 | Excellent 19.7% |
| Panamanians | 84.6 /100 | #142 | Excellent 19.7% |
| Slavs | 84.4 /100 | #143 | Excellent 19.7% |
| Immigrants | Northern Africa | 84.1 /100 | #144 | Excellent 19.7% |
| Canadians | 83.8 /100 | #145 | Excellent 19.7% |
| Immigrants | Bosnia and Herzegovina | 83.6 /100 | #146 | Excellent 19.7% |
| Immigrants | Austria | 83.1 /100 | #147 | Excellent 19.7% |
Demographics Similar to Apache by Female Poverty Among 18-24 Year Olds
In terms of female poverty among 18-24 year olds, the demographic groups most similar to Apache are Houma (26.2%, a difference of 0.53%), Chippewa (25.9%, a difference of 1.6%), Pueblo (26.9%, a difference of 2.2%), Immigrants from Somalia (25.7%, a difference of 2.2%), and Cajun (25.7%, a difference of 2.5%).
| Demographics | Rating | Rank | Female Poverty Among 18-24 Year Olds |
| Yakama | 0.0 /100 | #326 | Tragic 25.3% |
| Ute | 0.0 /100 | #327 | Tragic 25.4% |
| Natives/Alaskans | 0.0 /100 | #328 | Tragic 25.4% |
| Cajuns | 0.0 /100 | #329 | Tragic 25.7% |
| Immigrants | Somalia | 0.0 /100 | #330 | Tragic 25.7% |
| Chippewa | 0.0 /100 | #331 | Tragic 25.9% |
| Houma | 0.0 /100 | #332 | Tragic 26.2% |
| Apache | 0.0 /100 | #333 | Tragic 26.3% |
| Pueblo | 0.0 /100 | #334 | Tragic 26.9% |
| Yup'ik | 0.0 /100 | #335 | Tragic 27.0% |
| Immigrants | Yemen | 0.0 /100 | #336 | Tragic 27.5% |
| Cheyenne | 0.0 /100 | #337 | Tragic 28.1% |
| Hopi | 0.0 /100 | #338 | Tragic 28.2% |
| Pima | 0.0 /100 | #339 | Tragic 28.4% |
| Sioux | 0.0 /100 | #340 | Tragic 28.6% |