Barbadian vs Apache Married-couple Households
COMPARE
Barbadian
Apache
Married-couple Households
Married-couple Households Comparison
Barbadians
Apache
39.4%
MARRIED-COUPLE HOUSEHOLDS
0.0/ 100
METRIC RATING
328th/ 347
METRIC RANK
43.9%
MARRIED-COUPLE HOUSEHOLDS
0.3/ 100
METRIC RATING
254th/ 347
METRIC RANK
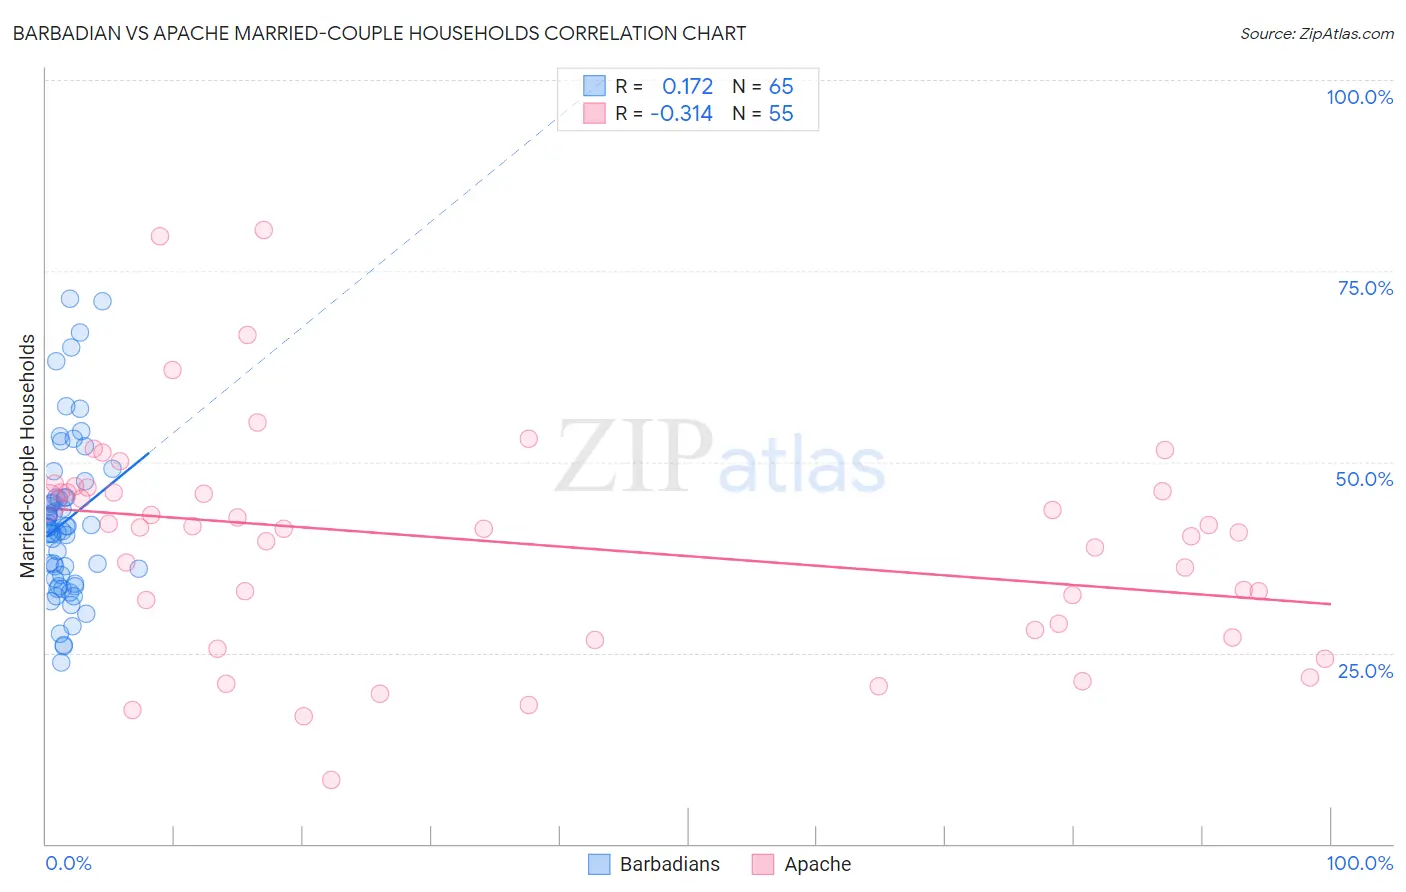
Barbadian vs Apache Married-couple Households Correlation Chart
The statistical analysis conducted on geographies consisting of 141,274,787 people shows a poor positive correlation between the proportion of Barbadians and percentage of married-couple family households in the United States with a correlation coefficient (R) of 0.172 and weighted average of 39.4%. Similarly, the statistical analysis conducted on geographies consisting of 231,040,334 people shows a mild negative correlation between the proportion of Apache and percentage of married-couple family households in the United States with a correlation coefficient (R) of -0.314 and weighted average of 43.9%, a difference of 11.5%.
Married-couple Households Correlation Summary
| Measurement | Barbadian | Apache |
| Minimum | 23.7% | 8.3% |
| Maximum | 71.4% | 80.3% |
| Range | 47.7% | 72.0% |
| Mean | 42.2% | 39.3% |
| Median | 41.4% | 41.3% |
| Interquartile 25% (IQ1) | 34.4% | 28.0% |
| Interquartile 75% (IQ3) | 45.3% | 46.1% |
| Interquartile Range (IQR) | 10.9% | 18.1% |
| Standard Deviation (Sample) | 10.5% | 14.5% |
| Standard Deviation (Population) | 10.5% | 14.4% |
Similar Demographics by Married-couple Households
Demographics Similar to Barbadians by Married-couple Households
In terms of married-couple households, the demographic groups most similar to Barbadians are Immigrants from Dominica (39.4%, a difference of 0.080%), Lumbee (39.6%, a difference of 0.50%), Immigrants from Barbados (39.2%, a difference of 0.52%), Immigrants from Congo (39.0%, a difference of 0.95%), and U.S. Virgin Islander (39.8%, a difference of 0.97%).
| Demographics | Rating | Rank | Married-couple Households |
| Immigrants | Liberia | 0.0 /100 | #321 | Tragic 40.3% |
| Immigrants | Zaire | 0.0 /100 | #322 | Tragic 40.1% |
| Puerto Ricans | 0.0 /100 | #323 | Tragic 40.1% |
| Navajo | 0.0 /100 | #324 | Tragic 40.1% |
| Pueblo | 0.0 /100 | #325 | Tragic 40.0% |
| U.S. Virgin Islanders | 0.0 /100 | #326 | Tragic 39.8% |
| Lumbee | 0.0 /100 | #327 | Tragic 39.6% |
| Barbadians | 0.0 /100 | #328 | Tragic 39.4% |
| Immigrants | Dominica | 0.0 /100 | #329 | Tragic 39.4% |
| Immigrants | Barbados | 0.0 /100 | #330 | Tragic 39.2% |
| Immigrants | Congo | 0.0 /100 | #331 | Tragic 39.0% |
| Somalis | 0.0 /100 | #332 | Tragic 39.0% |
| Immigrants | West Indies | 0.0 /100 | #333 | Tragic 39.0% |
| Immigrants | St. Vincent and the Grenadines | 0.0 /100 | #334 | Tragic 38.7% |
| Senegalese | 0.0 /100 | #335 | Tragic 38.6% |
Demographics Similar to Apache by Married-couple Households
In terms of married-couple households, the demographic groups most similar to Apache are Shoshone (43.9%, a difference of 0.020%), Central American (43.9%, a difference of 0.050%), Ugandan (43.8%, a difference of 0.16%), Seminole (44.0%, a difference of 0.17%), and German Russian (44.0%, a difference of 0.24%).
| Demographics | Rating | Rank | Married-couple Households |
| Immigrants | Morocco | 0.6 /100 | #247 | Tragic 44.2% |
| Yup'ik | 0.4 /100 | #248 | Tragic 44.1% |
| Immigrants | Kenya | 0.4 /100 | #249 | Tragic 44.1% |
| French American Indians | 0.4 /100 | #250 | Tragic 44.1% |
| German Russians | 0.4 /100 | #251 | Tragic 44.0% |
| Seminole | 0.4 /100 | #252 | Tragic 44.0% |
| Central Americans | 0.3 /100 | #253 | Tragic 43.9% |
| Apache | 0.3 /100 | #254 | Tragic 43.9% |
| Shoshone | 0.3 /100 | #255 | Tragic 43.9% |
| Ugandans | 0.3 /100 | #256 | Tragic 43.8% |
| Blackfeet | 0.2 /100 | #257 | Tragic 43.8% |
| Central American Indians | 0.2 /100 | #258 | Tragic 43.8% |
| Iroquois | 0.2 /100 | #259 | Tragic 43.7% |
| Immigrants | Cameroon | 0.2 /100 | #260 | Tragic 43.7% |
| Alaskan Athabascans | 0.2 /100 | #261 | Tragic 43.6% |