Laotian vs Apache Married-couple Households
COMPARE
Laotian
Apache
Married-couple Households
Married-couple Households Comparison
Laotians
Apache
48.4%
MARRIED-COUPLE HOUSEHOLDS
98.8/ 100
METRIC RATING
71st/ 347
METRIC RANK
43.9%
MARRIED-COUPLE HOUSEHOLDS
0.3/ 100
METRIC RATING
254th/ 347
METRIC RANK
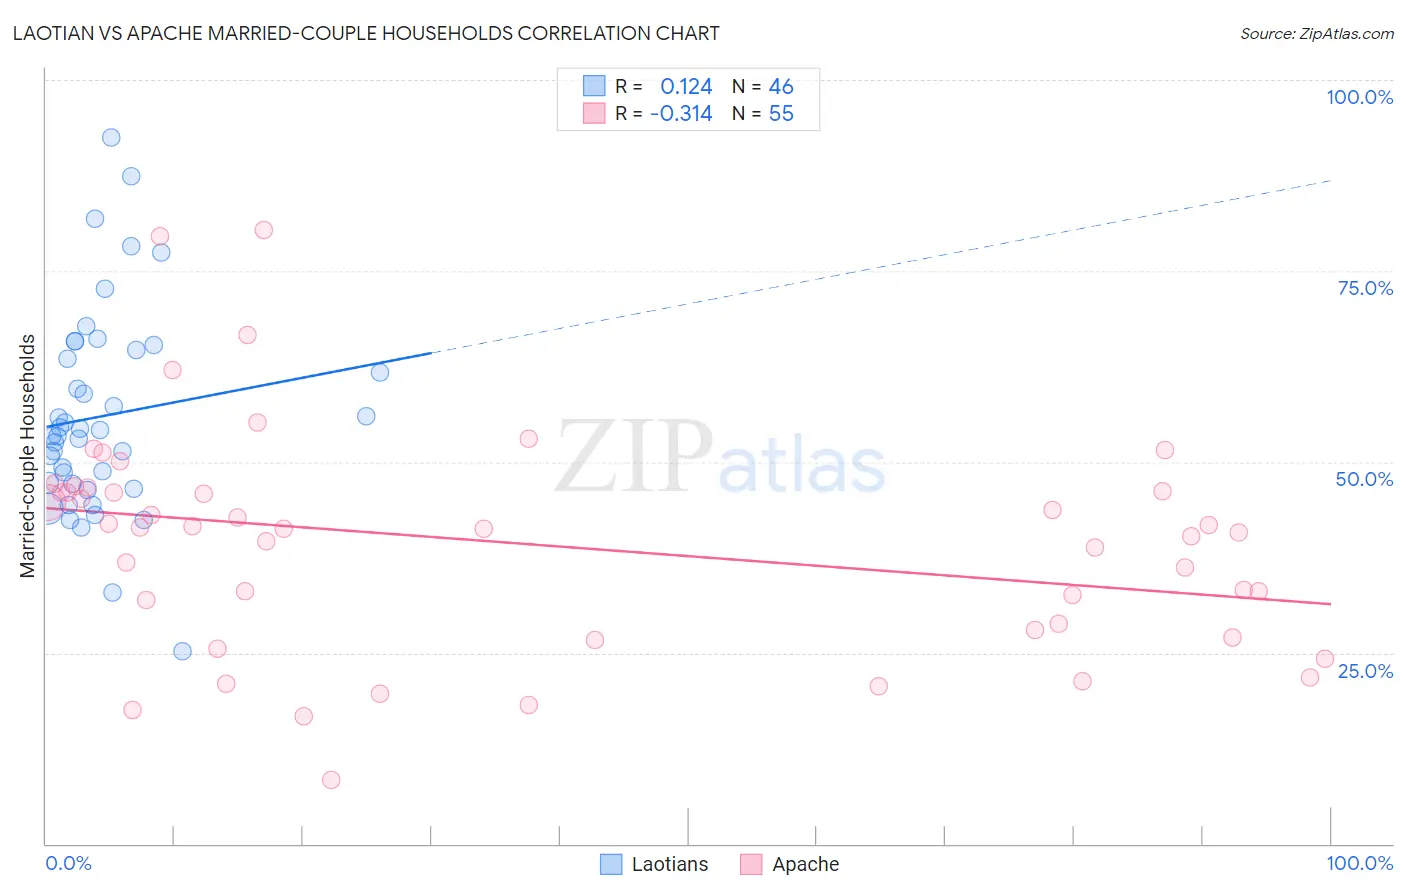
Laotian vs Apache Married-couple Households Correlation Chart
The statistical analysis conducted on geographies consisting of 224,741,438 people shows a poor positive correlation between the proportion of Laotians and percentage of married-couple family households in the United States with a correlation coefficient (R) of 0.124 and weighted average of 48.4%. Similarly, the statistical analysis conducted on geographies consisting of 231,040,334 people shows a mild negative correlation between the proportion of Apache and percentage of married-couple family households in the United States with a correlation coefficient (R) of -0.314 and weighted average of 43.9%, a difference of 10.2%.
Married-couple Households Correlation Summary
| Measurement | Laotian | Apache |
| Minimum | 25.2% | 8.3% |
| Maximum | 92.4% | 80.3% |
| Range | 67.2% | 72.0% |
| Mean | 56.0% | 39.3% |
| Median | 53.8% | 41.3% |
| Interquartile 25% (IQ1) | 47.2% | 28.0% |
| Interquartile 75% (IQ3) | 64.7% | 46.1% |
| Interquartile Range (IQR) | 17.5% | 18.1% |
| Standard Deviation (Sample) | 13.5% | 14.5% |
| Standard Deviation (Population) | 13.3% | 14.4% |
Similar Demographics by Married-couple Households
Demographics Similar to Laotians by Married-couple Households
In terms of married-couple households, the demographic groups most similar to Laotians are Immigrants from North America (48.4%, a difference of 0.010%), Immigrants from South Eastern Asia (48.4%, a difference of 0.050%), Immigrants from China (48.4%, a difference of 0.050%), Jordanian (48.4%, a difference of 0.070%), and Romanian (48.4%, a difference of 0.070%).
| Demographics | Rating | Rank | Married-couple Households |
| Northern Europeans | 99.0 /100 | #64 | Exceptional 48.4% |
| Immigrants | Canada | 99.0 /100 | #65 | Exceptional 48.4% |
| Jordanians | 98.9 /100 | #66 | Exceptional 48.4% |
| Romanians | 98.9 /100 | #67 | Exceptional 48.4% |
| Immigrants | South Eastern Asia | 98.9 /100 | #68 | Exceptional 48.4% |
| Immigrants | China | 98.9 /100 | #69 | Exceptional 48.4% |
| Immigrants | North America | 98.9 /100 | #70 | Exceptional 48.4% |
| Laotians | 98.8 /100 | #71 | Exceptional 48.4% |
| Scotch-Irish | 98.6 /100 | #72 | Exceptional 48.3% |
| Immigrants | Singapore | 98.6 /100 | #73 | Exceptional 48.3% |
| Immigrants | Romania | 98.6 /100 | #74 | Exceptional 48.3% |
| Immigrants | England | 98.4 /100 | #75 | Exceptional 48.2% |
| Immigrants | Fiji | 98.4 /100 | #76 | Exceptional 48.2% |
| Canadians | 98.2 /100 | #77 | Exceptional 48.2% |
| Egyptians | 98.2 /100 | #78 | Exceptional 48.2% |
Demographics Similar to Apache by Married-couple Households
In terms of married-couple households, the demographic groups most similar to Apache are Shoshone (43.9%, a difference of 0.020%), Central American (43.9%, a difference of 0.050%), Ugandan (43.8%, a difference of 0.16%), Seminole (44.0%, a difference of 0.17%), and German Russian (44.0%, a difference of 0.24%).
| Demographics | Rating | Rank | Married-couple Households |
| Immigrants | Morocco | 0.6 /100 | #247 | Tragic 44.2% |
| Yup'ik | 0.4 /100 | #248 | Tragic 44.1% |
| Immigrants | Kenya | 0.4 /100 | #249 | Tragic 44.1% |
| French American Indians | 0.4 /100 | #250 | Tragic 44.1% |
| German Russians | 0.4 /100 | #251 | Tragic 44.0% |
| Seminole | 0.4 /100 | #252 | Tragic 44.0% |
| Central Americans | 0.3 /100 | #253 | Tragic 43.9% |
| Apache | 0.3 /100 | #254 | Tragic 43.9% |
| Shoshone | 0.3 /100 | #255 | Tragic 43.9% |
| Ugandans | 0.3 /100 | #256 | Tragic 43.8% |
| Blackfeet | 0.2 /100 | #257 | Tragic 43.8% |
| Central American Indians | 0.2 /100 | #258 | Tragic 43.8% |
| Iroquois | 0.2 /100 | #259 | Tragic 43.7% |
| Immigrants | Cameroon | 0.2 /100 | #260 | Tragic 43.7% |
| Alaskan Athabascans | 0.2 /100 | #261 | Tragic 43.6% |