Immigrants from Eritrea vs Immigrants from Malaysia Married-couple Households
COMPARE
Immigrants from Eritrea
Immigrants from Malaysia
Married-couple Households
Married-couple Households Comparison
Immigrants from Eritrea
Immigrants from Malaysia
42.1%
MARRIED-COUPLE HOUSEHOLDS
0.0/ 100
METRIC RATING
288th/ 347
METRIC RANK
47.2%
MARRIED-COUPLE HOUSEHOLDS
85.2/ 100
METRIC RATING
137th/ 347
METRIC RANK
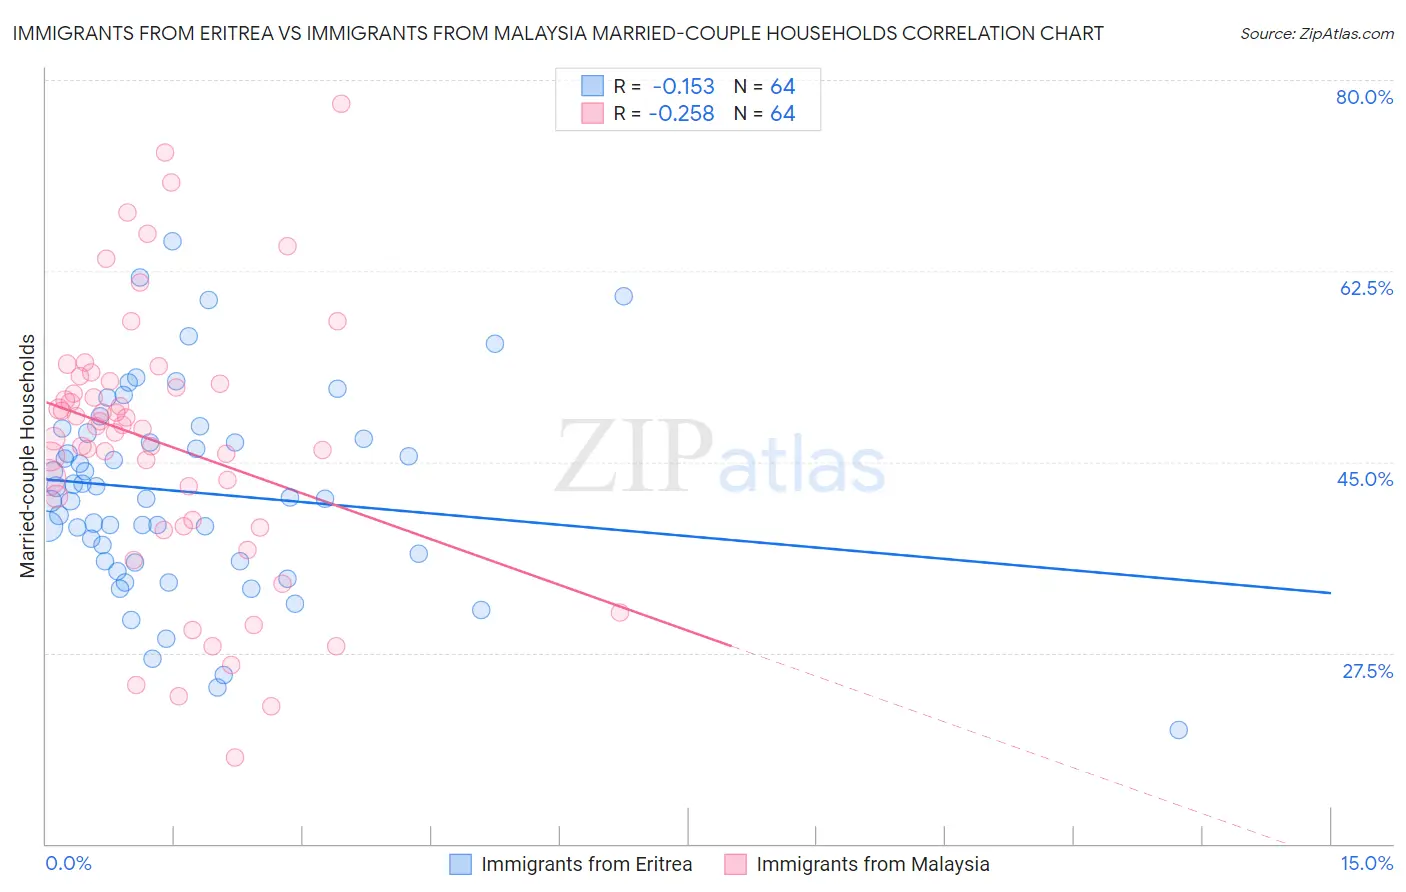
Immigrants from Eritrea vs Immigrants from Malaysia Married-couple Households Correlation Chart
The statistical analysis conducted on geographies consisting of 104,844,596 people shows a poor negative correlation between the proportion of Immigrants from Eritrea and percentage of married-couple family households in the United States with a correlation coefficient (R) of -0.153 and weighted average of 42.1%. Similarly, the statistical analysis conducted on geographies consisting of 197,920,674 people shows a weak negative correlation between the proportion of Immigrants from Malaysia and percentage of married-couple family households in the United States with a correlation coefficient (R) of -0.258 and weighted average of 47.2%, a difference of 12.1%.
Married-couple Households Correlation Summary
| Measurement | Immigrants from Eritrea | Immigrants from Malaysia |
| Minimum | 20.5% | 17.9% |
| Maximum | 65.2% | 77.8% |
| Range | 44.8% | 59.9% |
| Mean | 42.2% | 46.7% |
| Median | 41.7% | 48.2% |
| Interquartile 25% (IQ1) | 35.9% | 39.4% |
| Interquartile 75% (IQ3) | 47.4% | 52.3% |
| Interquartile Range (IQR) | 11.5% | 12.8% |
| Standard Deviation (Sample) | 9.2% | 12.4% |
| Standard Deviation (Population) | 9.1% | 12.3% |
Similar Demographics by Married-couple Households
Demographics Similar to Immigrants from Eritrea by Married-couple Households
In terms of married-couple households, the demographic groups most similar to Immigrants from Eritrea are Sudanese (42.1%, a difference of 0.060%), Chippewa (42.1%, a difference of 0.080%), Honduran (42.1%, a difference of 0.11%), Paiute (42.1%, a difference of 0.11%), and Indonesian (42.0%, a difference of 0.16%).
| Demographics | Rating | Rank | Married-couple Households |
| Immigrants | Guatemala | 0.0 /100 | #281 | Tragic 42.8% |
| Bermudans | 0.0 /100 | #282 | Tragic 42.4% |
| Inupiat | 0.0 /100 | #283 | Tragic 42.4% |
| Cheyenne | 0.0 /100 | #284 | Tragic 42.3% |
| Ghanaians | 0.0 /100 | #285 | Tragic 42.2% |
| Belizeans | 0.0 /100 | #286 | Tragic 42.2% |
| Chippewa | 0.0 /100 | #287 | Tragic 42.1% |
| Immigrants | Eritrea | 0.0 /100 | #288 | Tragic 42.1% |
| Sudanese | 0.0 /100 | #289 | Tragic 42.1% |
| Hondurans | 0.0 /100 | #290 | Tragic 42.1% |
| Paiute | 0.0 /100 | #291 | Tragic 42.1% |
| Indonesians | 0.0 /100 | #292 | Tragic 42.0% |
| Menominee | 0.0 /100 | #293 | Tragic 42.0% |
| Immigrants | Yemen | 0.0 /100 | #294 | Tragic 42.0% |
| Kiowa | 0.0 /100 | #295 | Tragic 42.0% |
Demographics Similar to Immigrants from Malaysia by Married-couple Households
In terms of married-couple households, the demographic groups most similar to Immigrants from Malaysia are New Zealander (47.2%, a difference of 0.0%), Immigrants from Afghanistan (47.2%, a difference of 0.010%), Immigrants from Sweden (47.2%, a difference of 0.040%), Immigrants from Greece (47.2%, a difference of 0.060%), and Immigrants from Argentina (47.2%, a difference of 0.060%).
| Demographics | Rating | Rank | Married-couple Households |
| Immigrants | Hungary | 87.8 /100 | #130 | Excellent 47.3% |
| Immigrants | Denmark | 87.5 /100 | #131 | Excellent 47.3% |
| Immigrants | Ukraine | 86.7 /100 | #132 | Excellent 47.3% |
| South Africans | 86.4 /100 | #133 | Excellent 47.3% |
| Immigrants | Greece | 86.0 /100 | #134 | Excellent 47.2% |
| Immigrants | Argentina | 86.0 /100 | #135 | Excellent 47.2% |
| New Zealanders | 85.3 /100 | #136 | Excellent 47.2% |
| Immigrants | Malaysia | 85.2 /100 | #137 | Excellent 47.2% |
| Immigrants | Afghanistan | 85.1 /100 | #138 | Excellent 47.2% |
| Immigrants | Sweden | 84.7 /100 | #139 | Excellent 47.2% |
| Spanish | 84.5 /100 | #140 | Excellent 47.2% |
| Costa Ricans | 84.4 /100 | #141 | Excellent 47.2% |
| Spaniards | 84.1 /100 | #142 | Excellent 47.2% |
| Immigrants | Belarus | 83.8 /100 | #143 | Excellent 47.2% |
| Mexicans | 83.4 /100 | #144 | Excellent 47.1% |