Immigrants from Eritrea vs Immigrants from Pakistan Married-couple Households
COMPARE
Immigrants from Eritrea
Immigrants from Pakistan
Married-couple Households
Married-couple Households Comparison
Immigrants from Eritrea
Immigrants from Pakistan
42.1%
MARRIED-COUPLE HOUSEHOLDS
0.0/ 100
METRIC RATING
288th/ 347
METRIC RANK
50.1%
MARRIED-COUPLE HOUSEHOLDS
100.0/ 100
METRIC RATING
11th/ 347
METRIC RANK
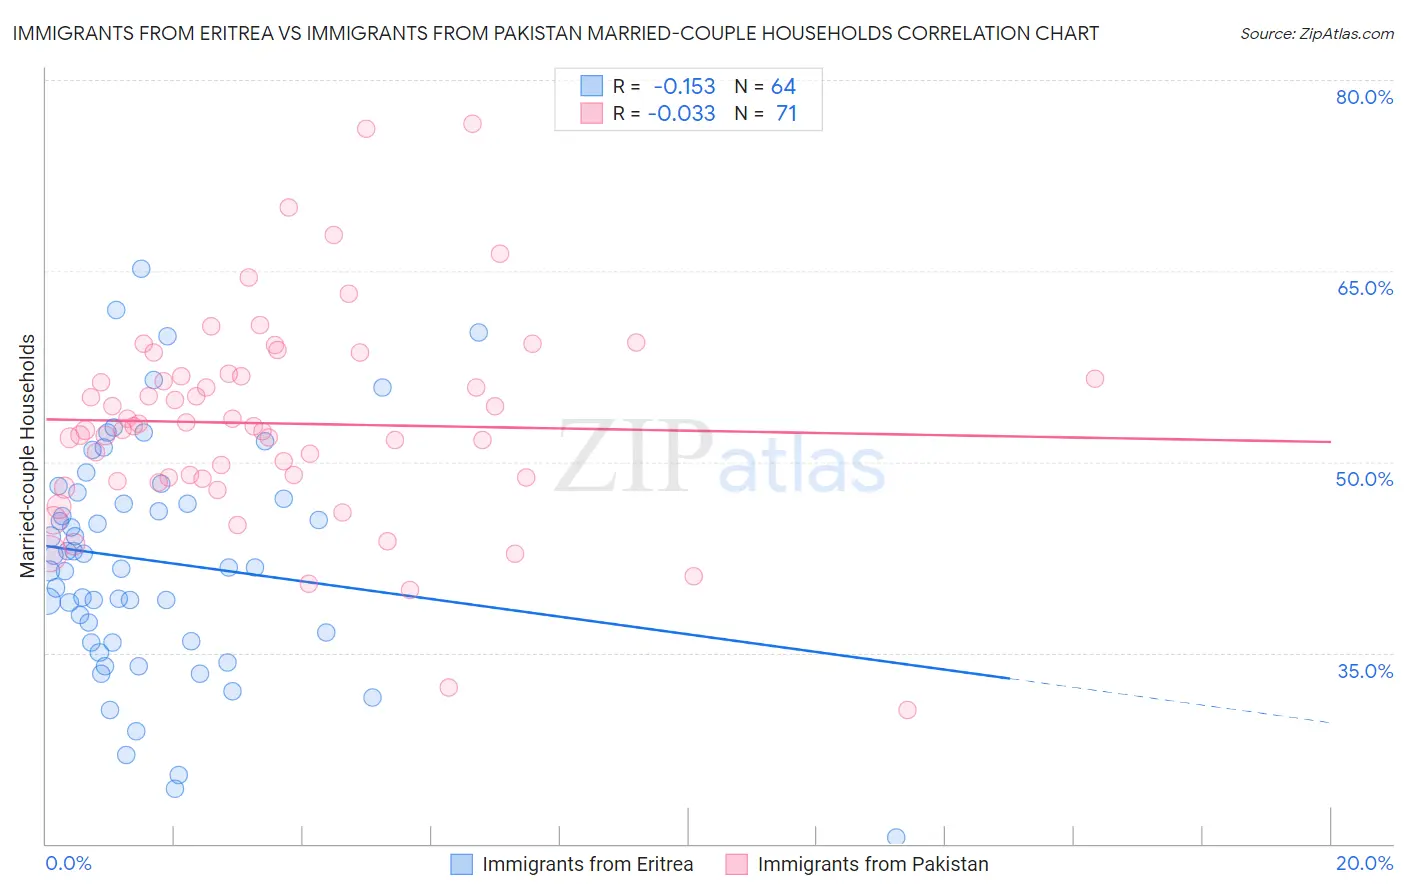
Immigrants from Eritrea vs Immigrants from Pakistan Married-couple Households Correlation Chart
The statistical analysis conducted on geographies consisting of 104,844,596 people shows a poor negative correlation between the proportion of Immigrants from Eritrea and percentage of married-couple family households in the United States with a correlation coefficient (R) of -0.153 and weighted average of 42.1%. Similarly, the statistical analysis conducted on geographies consisting of 283,790,790 people shows no correlation between the proportion of Immigrants from Pakistan and percentage of married-couple family households in the United States with a correlation coefficient (R) of -0.033 and weighted average of 50.1%, a difference of 19.1%.
Married-couple Households Correlation Summary
| Measurement | Immigrants from Eritrea | Immigrants from Pakistan |
| Minimum | 20.5% | 30.6% |
| Maximum | 65.2% | 76.6% |
| Range | 44.8% | 46.0% |
| Mean | 42.2% | 53.0% |
| Median | 41.7% | 52.8% |
| Interquartile 25% (IQ1) | 35.9% | 48.7% |
| Interquartile 75% (IQ3) | 47.4% | 56.7% |
| Interquartile Range (IQR) | 11.5% | 8.1% |
| Standard Deviation (Sample) | 9.2% | 8.2% |
| Standard Deviation (Population) | 9.1% | 8.2% |
Similar Demographics by Married-couple Households
Demographics Similar to Immigrants from Eritrea by Married-couple Households
In terms of married-couple households, the demographic groups most similar to Immigrants from Eritrea are Sudanese (42.1%, a difference of 0.060%), Chippewa (42.1%, a difference of 0.080%), Honduran (42.1%, a difference of 0.11%), Paiute (42.1%, a difference of 0.11%), and Indonesian (42.0%, a difference of 0.16%).
| Demographics | Rating | Rank | Married-couple Households |
| Immigrants | Guatemala | 0.0 /100 | #281 | Tragic 42.8% |
| Bermudans | 0.0 /100 | #282 | Tragic 42.4% |
| Inupiat | 0.0 /100 | #283 | Tragic 42.4% |
| Cheyenne | 0.0 /100 | #284 | Tragic 42.3% |
| Ghanaians | 0.0 /100 | #285 | Tragic 42.2% |
| Belizeans | 0.0 /100 | #286 | Tragic 42.2% |
| Chippewa | 0.0 /100 | #287 | Tragic 42.1% |
| Immigrants | Eritrea | 0.0 /100 | #288 | Tragic 42.1% |
| Sudanese | 0.0 /100 | #289 | Tragic 42.1% |
| Hondurans | 0.0 /100 | #290 | Tragic 42.1% |
| Paiute | 0.0 /100 | #291 | Tragic 42.1% |
| Indonesians | 0.0 /100 | #292 | Tragic 42.0% |
| Menominee | 0.0 /100 | #293 | Tragic 42.0% |
| Immigrants | Yemen | 0.0 /100 | #294 | Tragic 42.0% |
| Kiowa | 0.0 /100 | #295 | Tragic 42.0% |
Demographics Similar to Immigrants from Pakistan by Married-couple Households
In terms of married-couple households, the demographic groups most similar to Immigrants from Pakistan are Swiss (49.9%, a difference of 0.37%), Pennsylvania German (50.4%, a difference of 0.44%), Chinese (50.4%, a difference of 0.44%), Immigrants from Korea (49.9%, a difference of 0.54%), and Burmese (49.8%, a difference of 0.66%).
| Demographics | Rating | Rank | Married-couple Households |
| Assyrians/Chaldeans/Syriacs | 100.0 /100 | #4 | Exceptional 51.8% |
| Tongans | 100.0 /100 | #5 | Exceptional 51.6% |
| Danes | 100.0 /100 | #6 | Exceptional 51.1% |
| Filipinos | 100.0 /100 | #7 | Exceptional 51.0% |
| Immigrants | South Central Asia | 100.0 /100 | #8 | Exceptional 50.6% |
| Pennsylvania Germans | 100.0 /100 | #9 | Exceptional 50.4% |
| Chinese | 100.0 /100 | #10 | Exceptional 50.4% |
| Immigrants | Pakistan | 100.0 /100 | #11 | Exceptional 50.1% |
| Swiss | 100.0 /100 | #12 | Exceptional 49.9% |
| Immigrants | Korea | 100.0 /100 | #13 | Exceptional 49.9% |
| Burmese | 100.0 /100 | #14 | Exceptional 49.8% |
| Koreans | 99.9 /100 | #15 | Exceptional 49.7% |
| Swedes | 99.9 /100 | #16 | Exceptional 49.7% |
| Immigrants | Hong Kong | 99.9 /100 | #17 | Exceptional 49.6% |
| English | 99.9 /100 | #18 | Exceptional 49.6% |