Immigrants from Eritrea vs Hungarian Married-couple Households
COMPARE
Immigrants from Eritrea
Hungarian
Married-couple Households
Married-couple Households Comparison
Immigrants from Eritrea
Hungarians
42.1%
MARRIED-COUPLE HOUSEHOLDS
0.0/ 100
METRIC RATING
288th/ 347
METRIC RANK
49.1%
MARRIED-COUPLE HOUSEHOLDS
99.8/ 100
METRIC RATING
32nd/ 347
METRIC RANK
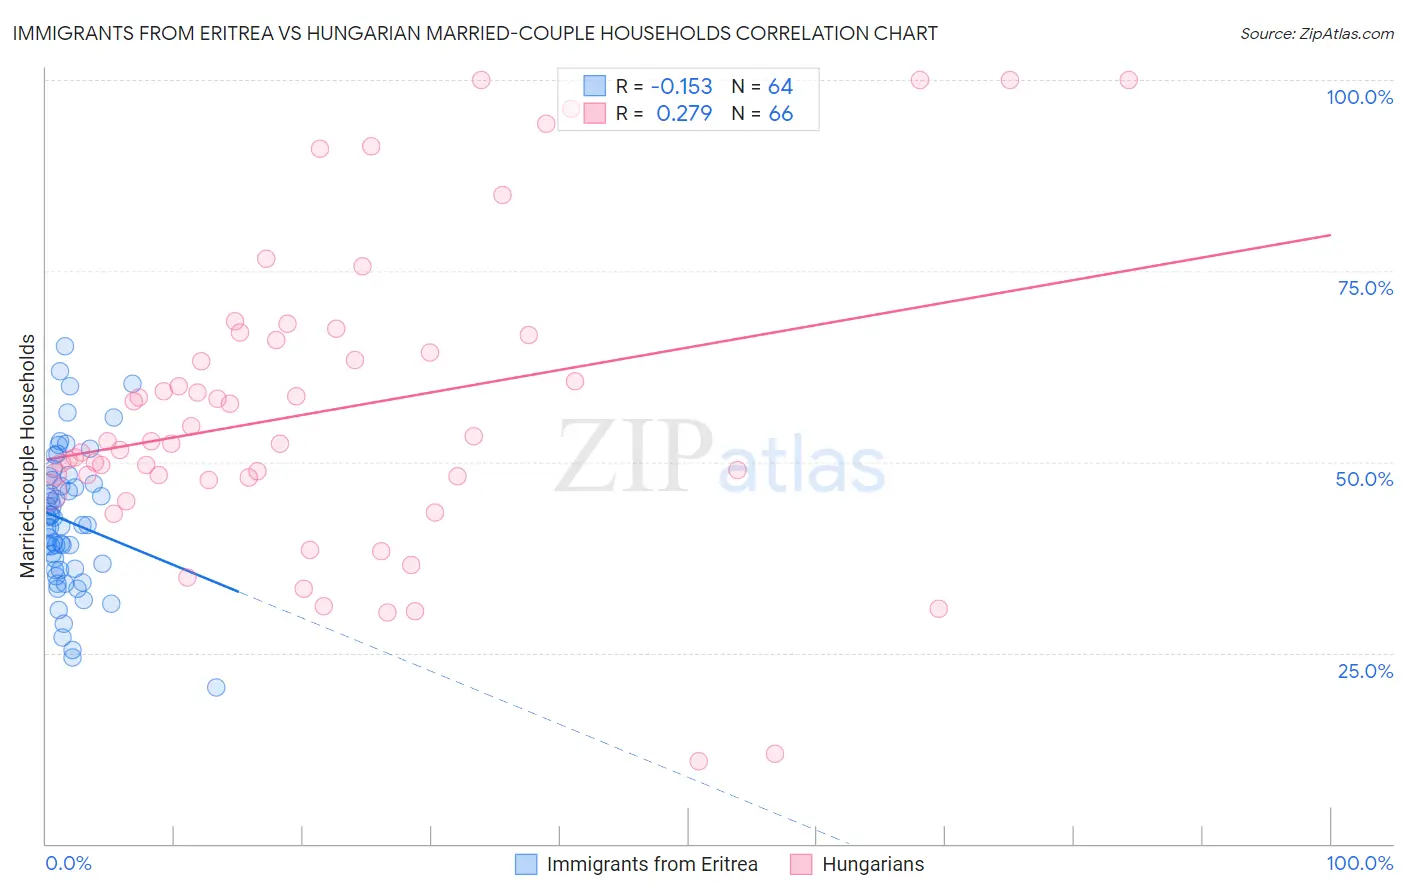
Immigrants from Eritrea vs Hungarian Married-couple Households Correlation Chart
The statistical analysis conducted on geographies consisting of 104,844,596 people shows a poor negative correlation between the proportion of Immigrants from Eritrea and percentage of married-couple family households in the United States with a correlation coefficient (R) of -0.153 and weighted average of 42.1%. Similarly, the statistical analysis conducted on geographies consisting of 485,875,006 people shows a weak positive correlation between the proportion of Hungarians and percentage of married-couple family households in the United States with a correlation coefficient (R) of 0.279 and weighted average of 49.1%, a difference of 16.6%.
Married-couple Households Correlation Summary
| Measurement | Immigrants from Eritrea | Hungarian |
| Minimum | 20.5% | 10.9% |
| Maximum | 65.2% | 100.0% |
| Range | 44.8% | 89.1% |
| Mean | 42.2% | 56.7% |
| Median | 41.7% | 52.5% |
| Interquartile 25% (IQ1) | 35.9% | 47.9% |
| Interquartile 75% (IQ3) | 47.4% | 65.9% |
| Interquartile Range (IQR) | 11.5% | 18.0% |
| Standard Deviation (Sample) | 9.2% | 19.9% |
| Standard Deviation (Population) | 9.1% | 19.8% |
Similar Demographics by Married-couple Households
Demographics Similar to Immigrants from Eritrea by Married-couple Households
In terms of married-couple households, the demographic groups most similar to Immigrants from Eritrea are Sudanese (42.1%, a difference of 0.060%), Chippewa (42.1%, a difference of 0.080%), Honduran (42.1%, a difference of 0.11%), Paiute (42.1%, a difference of 0.11%), and Indonesian (42.0%, a difference of 0.16%).
| Demographics | Rating | Rank | Married-couple Households |
| Immigrants | Guatemala | 0.0 /100 | #281 | Tragic 42.8% |
| Bermudans | 0.0 /100 | #282 | Tragic 42.4% |
| Inupiat | 0.0 /100 | #283 | Tragic 42.4% |
| Cheyenne | 0.0 /100 | #284 | Tragic 42.3% |
| Ghanaians | 0.0 /100 | #285 | Tragic 42.2% |
| Belizeans | 0.0 /100 | #286 | Tragic 42.2% |
| Chippewa | 0.0 /100 | #287 | Tragic 42.1% |
| Immigrants | Eritrea | 0.0 /100 | #288 | Tragic 42.1% |
| Sudanese | 0.0 /100 | #289 | Tragic 42.1% |
| Hondurans | 0.0 /100 | #290 | Tragic 42.1% |
| Paiute | 0.0 /100 | #291 | Tragic 42.1% |
| Indonesians | 0.0 /100 | #292 | Tragic 42.0% |
| Menominee | 0.0 /100 | #293 | Tragic 42.0% |
| Immigrants | Yemen | 0.0 /100 | #294 | Tragic 42.0% |
| Kiowa | 0.0 /100 | #295 | Tragic 42.0% |
Demographics Similar to Hungarians by Married-couple Households
In terms of married-couple households, the demographic groups most similar to Hungarians are Immigrants from Asia (49.1%, a difference of 0.030%), Native Hawaiian (49.1%, a difference of 0.060%), Italian (49.0%, a difference of 0.11%), Scottish (49.0%, a difference of 0.13%), and Bolivian (49.2%, a difference of 0.17%).
| Demographics | Rating | Rank | Married-couple Households |
| Immigrants | Philippines | 99.9 /100 | #25 | Exceptional 49.3% |
| Immigrants | Scotland | 99.8 /100 | #26 | Exceptional 49.3% |
| Bhutanese | 99.8 /100 | #27 | Exceptional 49.3% |
| Germans | 99.8 /100 | #28 | Exceptional 49.2% |
| Maltese | 99.8 /100 | #29 | Exceptional 49.2% |
| Bolivians | 99.8 /100 | #30 | Exceptional 49.2% |
| Native Hawaiians | 99.8 /100 | #31 | Exceptional 49.1% |
| Hungarians | 99.8 /100 | #32 | Exceptional 49.1% |
| Immigrants | Asia | 99.7 /100 | #33 | Exceptional 49.1% |
| Italians | 99.7 /100 | #34 | Exceptional 49.0% |
| Scottish | 99.7 /100 | #35 | Exceptional 49.0% |
| Iranians | 99.7 /100 | #36 | Exceptional 49.0% |
| Sri Lankans | 99.7 /100 | #37 | Exceptional 49.0% |
| Greeks | 99.7 /100 | #38 | Exceptional 48.9% |
| Lithuanians | 99.6 /100 | #39 | Exceptional 48.9% |