Immigrants from Eritrea vs Immigrants from Malaysia 4 or more Vehicles in Household
COMPARE
Immigrants from Eritrea
Immigrants from Malaysia
4 or more Vehicles in Household
4 or more Vehicles in Household Comparison
Immigrants from Eritrea
Immigrants from Malaysia
5.8%
4 OR MORE VEHICLES IN HOUSEHOLD
4.5/ 100
METRIC RATING
236th/ 347
METRIC RANK
5.9%
4 OR MORE VEHICLES IN HOUSEHOLD
6.7/ 100
METRIC RATING
230th/ 347
METRIC RANK
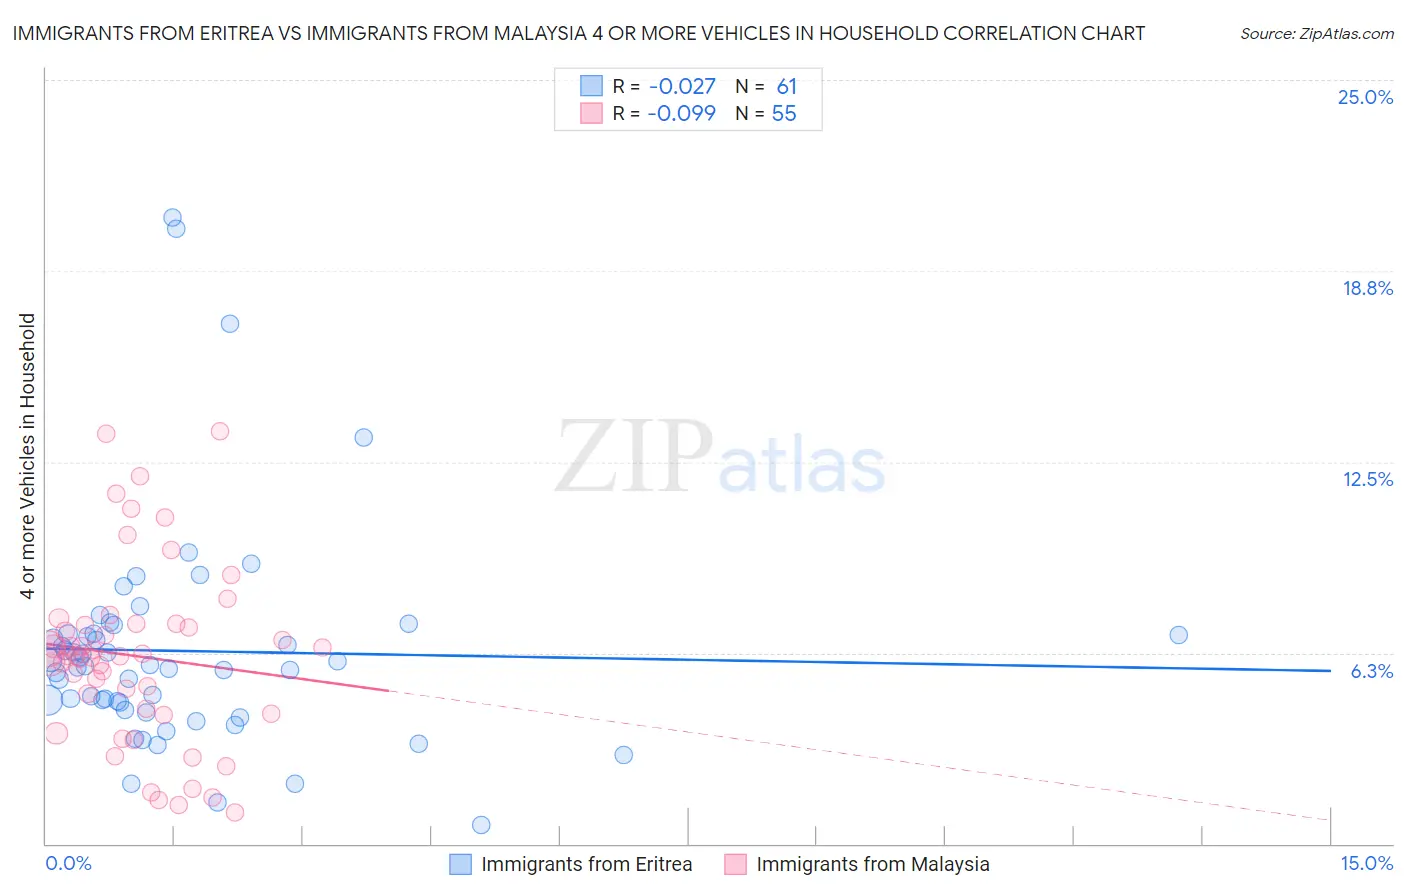
Immigrants from Eritrea vs Immigrants from Malaysia 4 or more Vehicles in Household Correlation Chart
The statistical analysis conducted on geographies consisting of 104,728,093 people shows no correlation between the proportion of Immigrants from Eritrea and percentage of households with 4 or more vehicles available in the United States with a correlation coefficient (R) of -0.027 and weighted average of 5.8%. Similarly, the statistical analysis conducted on geographies consisting of 197,160,103 people shows a slight negative correlation between the proportion of Immigrants from Malaysia and percentage of households with 4 or more vehicles available in the United States with a correlation coefficient (R) of -0.099 and weighted average of 5.9%, a difference of 1.1%.
4 or more Vehicles in Household Correlation Summary
| Measurement | Immigrants from Eritrea | Immigrants from Malaysia |
| Minimum | 0.61% | 1.0% |
| Maximum | 20.5% | 13.5% |
| Range | 19.9% | 12.5% |
| Mean | 6.3% | 6.1% |
| Median | 5.8% | 6.1% |
| Interquartile 25% (IQ1) | 4.5% | 4.3% |
| Interquartile 75% (IQ3) | 6.9% | 7.2% |
| Interquartile Range (IQR) | 2.4% | 2.9% |
| Standard Deviation (Sample) | 3.6% | 2.9% |
| Standard Deviation (Population) | 3.6% | 2.9% |
Demographics Similar to Immigrants from Eritrea and Immigrants from Malaysia by 4 or more Vehicles in Household
In terms of 4 or more vehicles in household, the demographic groups most similar to Immigrants from Eritrea are Immigrants from Hungary (5.8%, a difference of 0.010%), African (5.8%, a difference of 0.030%), Turkish (5.8%, a difference of 0.27%), Immigrants from Belgium (5.8%, a difference of 0.40%), and Immigrants from Australia (5.8%, a difference of 0.49%). Similarly, the demographic groups most similar to Immigrants from Malaysia are Eastern European (5.9%, a difference of 0.070%), Immigrants from Switzerland (5.9%, a difference of 0.12%), Immigrants from Argentina (5.9%, a difference of 0.30%), Sierra Leonean (5.9%, a difference of 0.31%), and Immigrants from Uganda (5.9%, a difference of 0.35%).
| Demographics | Rating | Rank | 4 or more Vehicles in Household |
| Immigrants | Kenya | 9.2 /100 | #223 | Tragic 6.0% |
| Cubans | 9.2 /100 | #224 | Tragic 6.0% |
| Indonesians | 8.9 /100 | #225 | Tragic 6.0% |
| Immigrants | Singapore | 7.9 /100 | #226 | Tragic 5.9% |
| Immigrants | Western Asia | 7.8 /100 | #227 | Tragic 5.9% |
| Immigrants | Uganda | 7.5 /100 | #228 | Tragic 5.9% |
| Eastern Europeans | 6.8 /100 | #229 | Tragic 5.9% |
| Immigrants | Malaysia | 6.7 /100 | #230 | Tragic 5.9% |
| Immigrants | Switzerland | 6.4 /100 | #231 | Tragic 5.9% |
| Immigrants | Argentina | 6.0 /100 | #232 | Tragic 5.9% |
| Sierra Leoneans | 6.0 /100 | #233 | Tragic 5.9% |
| Africans | 4.6 /100 | #234 | Tragic 5.8% |
| Immigrants | Hungary | 4.6 /100 | #235 | Tragic 5.8% |
| Immigrants | Eritrea | 4.5 /100 | #236 | Tragic 5.8% |
| Turks | 4.1 /100 | #237 | Tragic 5.8% |
| Immigrants | Belgium | 4.0 /100 | #238 | Tragic 5.8% |
| Immigrants | Australia | 3.8 /100 | #239 | Tragic 5.8% |
| Immigrants | Poland | 3.8 /100 | #240 | Tragic 5.8% |
| Mongolians | 3.7 /100 | #241 | Tragic 5.8% |
| Immigrants | Middle Africa | 3.4 /100 | #242 | Tragic 5.8% |
| Immigrants | Czechoslovakia | 3.2 /100 | #243 | Tragic 5.8% |