Immigrants from Eritrea vs Alaskan Athabascan Married-couple Households
COMPARE
Immigrants from Eritrea
Alaskan Athabascan
Married-couple Households
Married-couple Households Comparison
Immigrants from Eritrea
Alaskan Athabascans
42.1%
MARRIED-COUPLE HOUSEHOLDS
0.0/ 100
METRIC RATING
288th/ 347
METRIC RANK
43.6%
MARRIED-COUPLE HOUSEHOLDS
0.2/ 100
METRIC RATING
261st/ 347
METRIC RANK
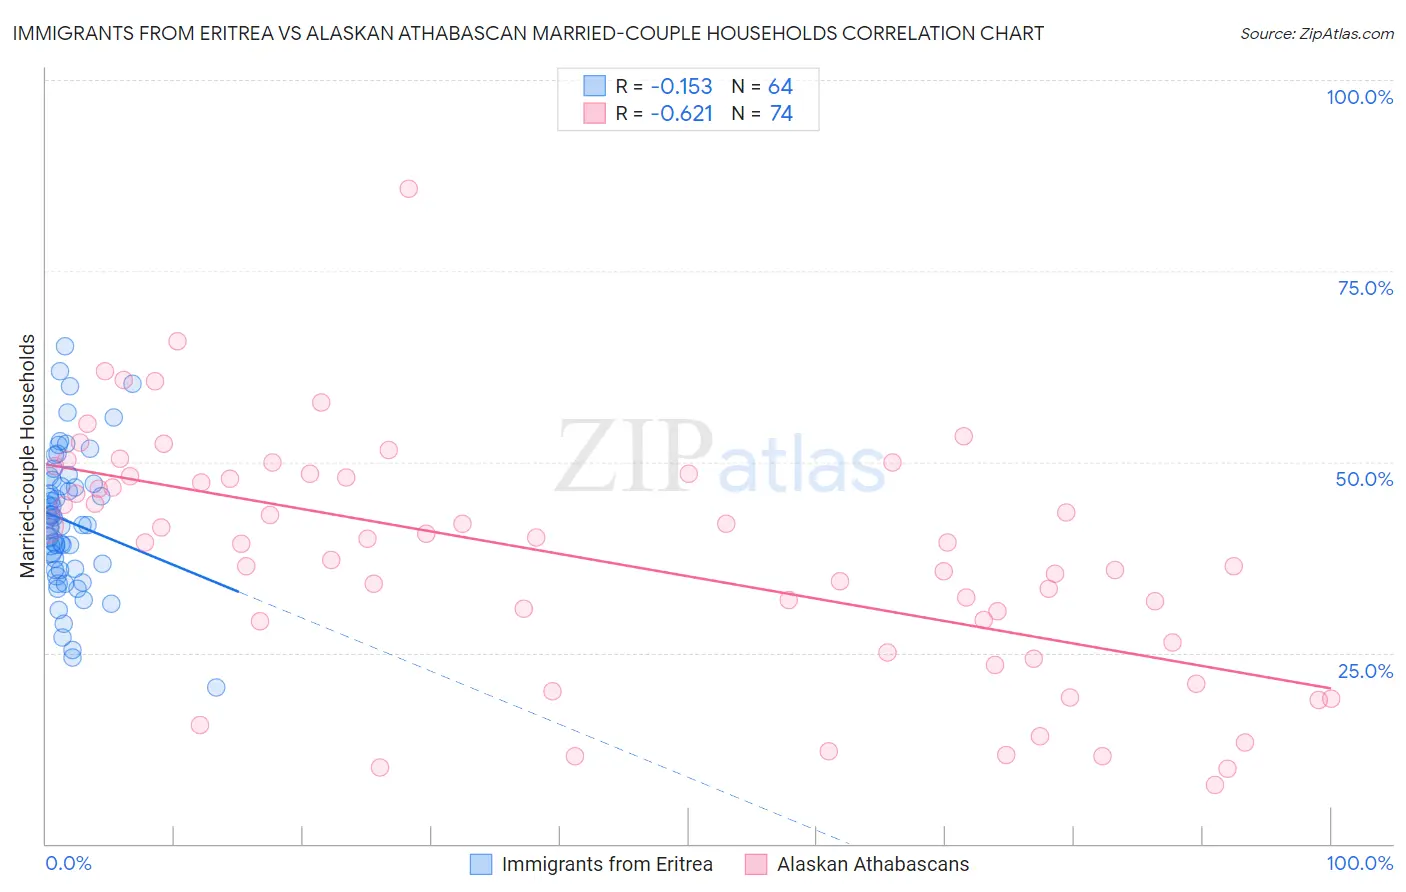
Immigrants from Eritrea vs Alaskan Athabascan Married-couple Households Correlation Chart
The statistical analysis conducted on geographies consisting of 104,844,596 people shows a poor negative correlation between the proportion of Immigrants from Eritrea and percentage of married-couple family households in the United States with a correlation coefficient (R) of -0.153 and weighted average of 42.1%. Similarly, the statistical analysis conducted on geographies consisting of 45,814,810 people shows a significant negative correlation between the proportion of Alaskan Athabascans and percentage of married-couple family households in the United States with a correlation coefficient (R) of -0.621 and weighted average of 43.6%, a difference of 3.7%.
Married-couple Households Correlation Summary
| Measurement | Immigrants from Eritrea | Alaskan Athabascan |
| Minimum | 20.5% | 7.7% |
| Maximum | 65.2% | 85.7% |
| Range | 44.8% | 78.0% |
| Mean | 42.2% | 37.3% |
| Median | 41.7% | 39.4% |
| Interquartile 25% (IQ1) | 35.9% | 26.4% |
| Interquartile 75% (IQ3) | 47.4% | 48.1% |
| Interquartile Range (IQR) | 11.5% | 21.7% |
| Standard Deviation (Sample) | 9.2% | 15.6% |
| Standard Deviation (Population) | 9.1% | 15.5% |
Similar Demographics by Married-couple Households
Demographics Similar to Immigrants from Eritrea by Married-couple Households
In terms of married-couple households, the demographic groups most similar to Immigrants from Eritrea are Sudanese (42.1%, a difference of 0.060%), Chippewa (42.1%, a difference of 0.080%), Honduran (42.1%, a difference of 0.11%), Paiute (42.1%, a difference of 0.11%), and Indonesian (42.0%, a difference of 0.16%).
| Demographics | Rating | Rank | Married-couple Households |
| Immigrants | Guatemala | 0.0 /100 | #281 | Tragic 42.8% |
| Bermudans | 0.0 /100 | #282 | Tragic 42.4% |
| Inupiat | 0.0 /100 | #283 | Tragic 42.4% |
| Cheyenne | 0.0 /100 | #284 | Tragic 42.3% |
| Ghanaians | 0.0 /100 | #285 | Tragic 42.2% |
| Belizeans | 0.0 /100 | #286 | Tragic 42.2% |
| Chippewa | 0.0 /100 | #287 | Tragic 42.1% |
| Immigrants | Eritrea | 0.0 /100 | #288 | Tragic 42.1% |
| Sudanese | 0.0 /100 | #289 | Tragic 42.1% |
| Hondurans | 0.0 /100 | #290 | Tragic 42.1% |
| Paiute | 0.0 /100 | #291 | Tragic 42.1% |
| Indonesians | 0.0 /100 | #292 | Tragic 42.0% |
| Menominee | 0.0 /100 | #293 | Tragic 42.0% |
| Immigrants | Yemen | 0.0 /100 | #294 | Tragic 42.0% |
| Kiowa | 0.0 /100 | #295 | Tragic 42.0% |
Demographics Similar to Alaskan Athabascans by Married-couple Households
In terms of married-couple households, the demographic groups most similar to Alaskan Athabascans are Vietnamese (43.6%, a difference of 0.060%), Immigrants from Cameroon (43.7%, a difference of 0.13%), Cree (43.6%, a difference of 0.17%), Iroquois (43.7%, a difference of 0.22%), and Central American Indian (43.8%, a difference of 0.25%).
| Demographics | Rating | Rank | Married-couple Households |
| Apache | 0.3 /100 | #254 | Tragic 43.9% |
| Shoshone | 0.3 /100 | #255 | Tragic 43.9% |
| Ugandans | 0.3 /100 | #256 | Tragic 43.8% |
| Blackfeet | 0.2 /100 | #257 | Tragic 43.8% |
| Central American Indians | 0.2 /100 | #258 | Tragic 43.8% |
| Iroquois | 0.2 /100 | #259 | Tragic 43.7% |
| Immigrants | Cameroon | 0.2 /100 | #260 | Tragic 43.7% |
| Alaskan Athabascans | 0.2 /100 | #261 | Tragic 43.6% |
| Vietnamese | 0.2 /100 | #262 | Tragic 43.6% |
| Cree | 0.1 /100 | #263 | Tragic 43.6% |
| Bangladeshis | 0.1 /100 | #264 | Tragic 43.5% |
| Moroccans | 0.1 /100 | #265 | Tragic 43.5% |
| Ecuadorians | 0.1 /100 | #266 | Tragic 43.5% |
| Natives/Alaskans | 0.1 /100 | #267 | Tragic 43.5% |
| Immigrants | Burma/Myanmar | 0.1 /100 | #268 | Tragic 43.4% |