Immigrants from Eritrea vs Immigrants from Vietnam Married-couple Households
COMPARE
Immigrants from Eritrea
Immigrants from Vietnam
Married-couple Households
Married-couple Households Comparison
Immigrants from Eritrea
Immigrants from Vietnam
42.1%
MARRIED-COUPLE HOUSEHOLDS
0.0/ 100
METRIC RATING
288th/ 347
METRIC RANK
48.8%
MARRIED-COUPLE HOUSEHOLDS
99.6/ 100
METRIC RATING
42nd/ 347
METRIC RANK
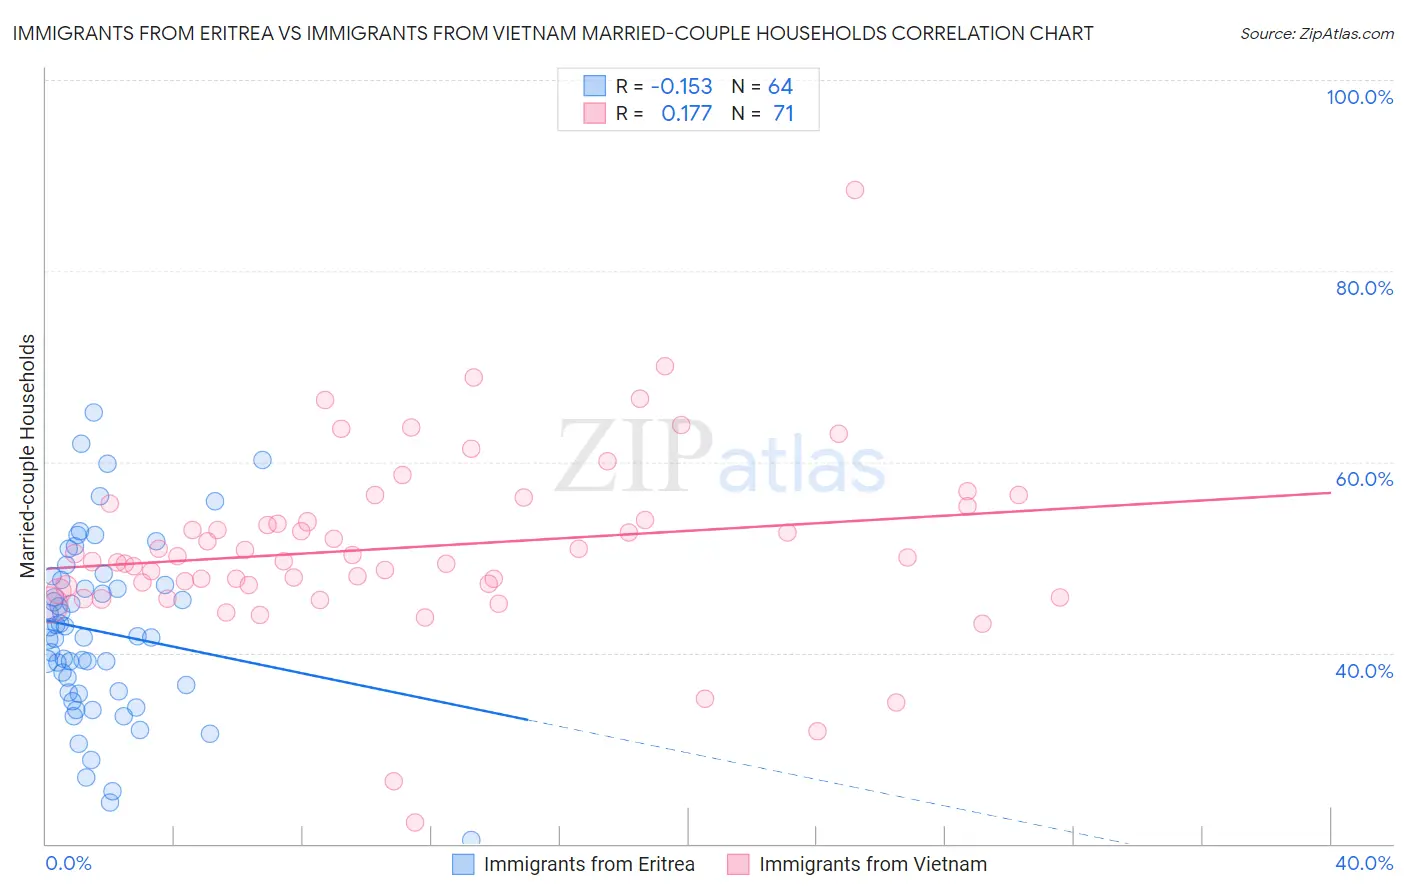
Immigrants from Eritrea vs Immigrants from Vietnam Married-couple Households Correlation Chart
The statistical analysis conducted on geographies consisting of 104,844,596 people shows a poor negative correlation between the proportion of Immigrants from Eritrea and percentage of married-couple family households in the United States with a correlation coefficient (R) of -0.153 and weighted average of 42.1%. Similarly, the statistical analysis conducted on geographies consisting of 404,551,130 people shows a poor positive correlation between the proportion of Immigrants from Vietnam and percentage of married-couple family households in the United States with a correlation coefficient (R) of 0.177 and weighted average of 48.8%, a difference of 16.0%.
Married-couple Households Correlation Summary
| Measurement | Immigrants from Eritrea | Immigrants from Vietnam |
| Minimum | 20.5% | 22.2% |
| Maximum | 65.2% | 88.5% |
| Range | 44.8% | 66.2% |
| Mean | 42.2% | 51.1% |
| Median | 41.7% | 49.9% |
| Interquartile 25% (IQ1) | 35.9% | 47.0% |
| Interquartile 75% (IQ3) | 47.4% | 55.3% |
| Interquartile Range (IQR) | 11.5% | 8.3% |
| Standard Deviation (Sample) | 9.2% | 9.7% |
| Standard Deviation (Population) | 9.1% | 9.6% |
Similar Demographics by Married-couple Households
Demographics Similar to Immigrants from Eritrea by Married-couple Households
In terms of married-couple households, the demographic groups most similar to Immigrants from Eritrea are Sudanese (42.1%, a difference of 0.060%), Chippewa (42.1%, a difference of 0.080%), Honduran (42.1%, a difference of 0.11%), Paiute (42.1%, a difference of 0.11%), and Indonesian (42.0%, a difference of 0.16%).
| Demographics | Rating | Rank | Married-couple Households |
| Immigrants | Guatemala | 0.0 /100 | #281 | Tragic 42.8% |
| Bermudans | 0.0 /100 | #282 | Tragic 42.4% |
| Inupiat | 0.0 /100 | #283 | Tragic 42.4% |
| Cheyenne | 0.0 /100 | #284 | Tragic 42.3% |
| Ghanaians | 0.0 /100 | #285 | Tragic 42.2% |
| Belizeans | 0.0 /100 | #286 | Tragic 42.2% |
| Chippewa | 0.0 /100 | #287 | Tragic 42.1% |
| Immigrants | Eritrea | 0.0 /100 | #288 | Tragic 42.1% |
| Sudanese | 0.0 /100 | #289 | Tragic 42.1% |
| Hondurans | 0.0 /100 | #290 | Tragic 42.1% |
| Paiute | 0.0 /100 | #291 | Tragic 42.1% |
| Indonesians | 0.0 /100 | #292 | Tragic 42.0% |
| Menominee | 0.0 /100 | #293 | Tragic 42.0% |
| Immigrants | Yemen | 0.0 /100 | #294 | Tragic 42.0% |
| Kiowa | 0.0 /100 | #295 | Tragic 42.0% |
Demographics Similar to Immigrants from Vietnam by Married-couple Households
In terms of married-couple households, the demographic groups most similar to Immigrants from Vietnam are Immigrants from Lebanon (48.9%, a difference of 0.050%), Immigrants from Iran (48.8%, a difference of 0.060%), Immigrants from Bolivia (48.9%, a difference of 0.080%), Lithuanian (48.9%, a difference of 0.090%), and Welsh (48.8%, a difference of 0.10%).
| Demographics | Rating | Rank | Married-couple Households |
| Scottish | 99.7 /100 | #35 | Exceptional 49.0% |
| Iranians | 99.7 /100 | #36 | Exceptional 49.0% |
| Sri Lankans | 99.7 /100 | #37 | Exceptional 49.0% |
| Greeks | 99.7 /100 | #38 | Exceptional 48.9% |
| Lithuanians | 99.6 /100 | #39 | Exceptional 48.9% |
| Immigrants | Bolivia | 99.6 /100 | #40 | Exceptional 48.9% |
| Immigrants | Lebanon | 99.6 /100 | #41 | Exceptional 48.9% |
| Immigrants | Vietnam | 99.6 /100 | #42 | Exceptional 48.8% |
| Immigrants | Iran | 99.6 /100 | #43 | Exceptional 48.8% |
| Welsh | 99.5 /100 | #44 | Exceptional 48.8% |
| Immigrants | Eastern Asia | 99.5 /100 | #45 | Exceptional 48.8% |
| Tsimshian | 99.5 /100 | #46 | Exceptional 48.7% |
| British | 99.5 /100 | #47 | Exceptional 48.7% |
| Indians (Asian) | 99.4 /100 | #48 | Exceptional 48.7% |
| Immigrants | Sri Lanka | 99.4 /100 | #49 | Exceptional 48.7% |