Immigrants from Mexico vs Immigrants from Malaysia Married-couple Households
COMPARE
Immigrants from Mexico
Immigrants from Malaysia
Married-couple Households
Married-couple Households Comparison
Immigrants from Mexico
Immigrants from Malaysia
46.4%
MARRIED-COUPLE HOUSEHOLDS
50.0/ 100
METRIC RATING
174th/ 347
METRIC RANK
47.2%
MARRIED-COUPLE HOUSEHOLDS
85.2/ 100
METRIC RATING
137th/ 347
METRIC RANK
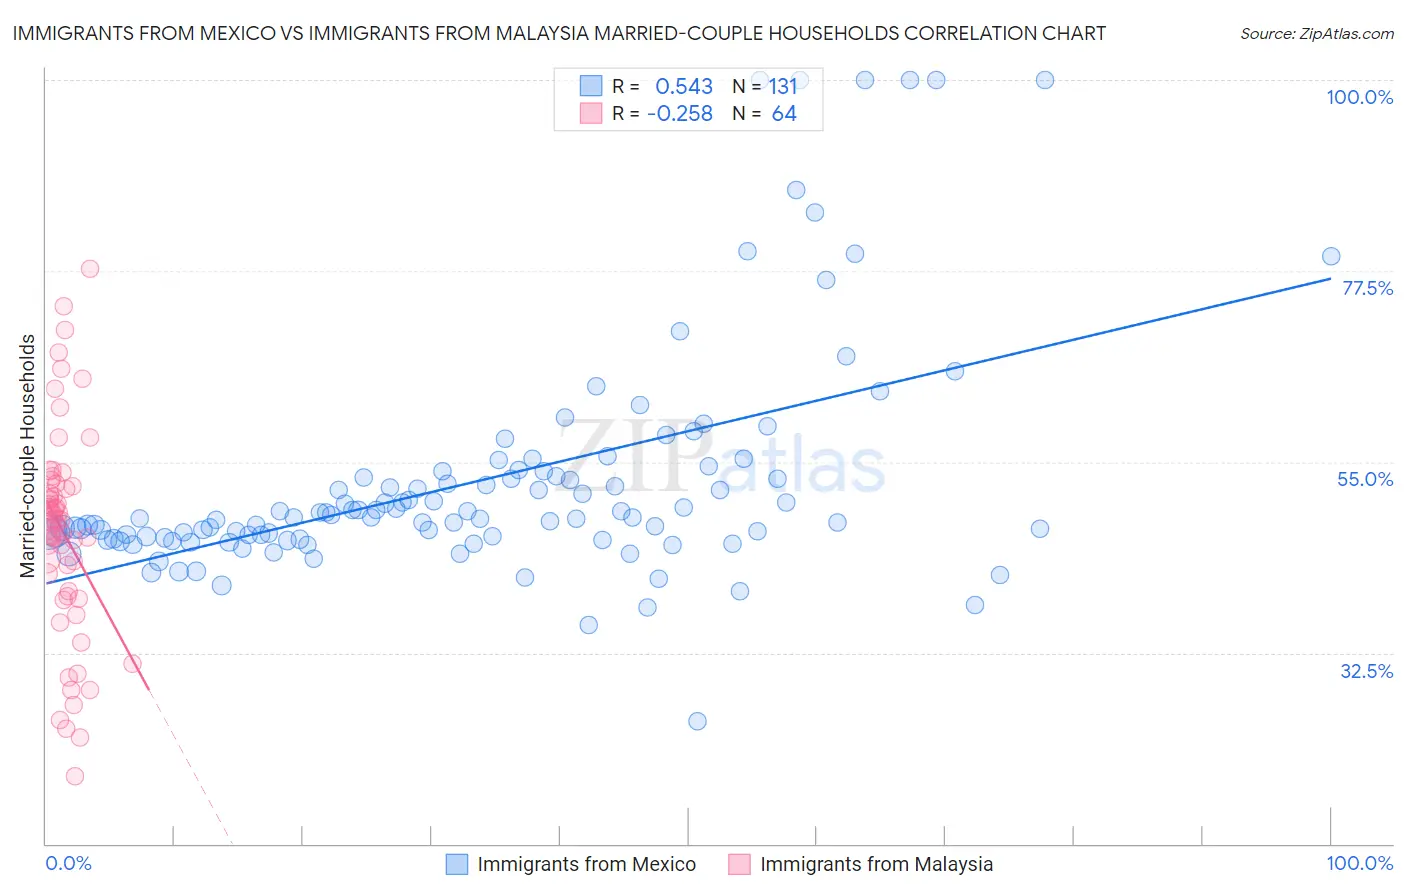
Immigrants from Mexico vs Immigrants from Malaysia Married-couple Households Correlation Chart
The statistical analysis conducted on geographies consisting of 513,378,899 people shows a substantial positive correlation between the proportion of Immigrants from Mexico and percentage of married-couple family households in the United States with a correlation coefficient (R) of 0.543 and weighted average of 46.4%. Similarly, the statistical analysis conducted on geographies consisting of 197,920,674 people shows a weak negative correlation between the proportion of Immigrants from Malaysia and percentage of married-couple family households in the United States with a correlation coefficient (R) of -0.258 and weighted average of 47.2%, a difference of 1.7%.
Married-couple Households Correlation Summary
| Measurement | Immigrants from Mexico | Immigrants from Malaysia |
| Minimum | 24.4% | 17.9% |
| Maximum | 100.0% | 77.8% |
| Range | 75.6% | 59.9% |
| Mean | 52.8% | 46.7% |
| Median | 48.4% | 48.2% |
| Interquartile 25% (IQ1) | 45.9% | 39.4% |
| Interquartile 75% (IQ3) | 53.3% | 52.3% |
| Interquartile Range (IQR) | 7.4% | 12.8% |
| Standard Deviation (Sample) | 13.8% | 12.4% |
| Standard Deviation (Population) | 13.7% | 12.3% |
Similar Demographics by Married-couple Households
Demographics Similar to Immigrants from Mexico by Married-couple Households
In terms of married-couple households, the demographic groups most similar to Immigrants from Mexico are Immigrants from Norway (46.5%, a difference of 0.070%), Immigrants from Colombia (46.4%, a difference of 0.15%), Immigrants from Australia (46.5%, a difference of 0.17%), Cajun (46.4%, a difference of 0.18%), and Immigrants from Chile (46.5%, a difference of 0.22%).
| Demographics | Rating | Rank | Married-couple Households |
| Immigrants | Croatia | 64.2 /100 | #167 | Good 46.7% |
| Israelis | 62.3 /100 | #168 | Good 46.7% |
| Spanish American Indians | 59.4 /100 | #169 | Average 46.6% |
| South Americans | 58.0 /100 | #170 | Average 46.6% |
| Immigrants | Chile | 55.7 /100 | #171 | Average 46.5% |
| Immigrants | Australia | 54.6 /100 | #172 | Average 46.5% |
| Immigrants | Norway | 52.0 /100 | #173 | Average 46.5% |
| Immigrants | Mexico | 50.0 /100 | #174 | Average 46.4% |
| Immigrants | Colombia | 46.1 /100 | #175 | Average 46.4% |
| Cajuns | 45.2 /100 | #176 | Average 46.4% |
| Immigrants | Immigrants | 43.8 /100 | #177 | Average 46.3% |
| Immigrants | Costa Rica | 43.4 /100 | #178 | Average 46.3% |
| Immigrants | Zimbabwe | 43.0 /100 | #179 | Average 46.3% |
| Mongolians | 42.0 /100 | #180 | Average 46.3% |
| Malaysians | 41.8 /100 | #181 | Average 46.3% |
Demographics Similar to Immigrants from Malaysia by Married-couple Households
In terms of married-couple households, the demographic groups most similar to Immigrants from Malaysia are New Zealander (47.2%, a difference of 0.0%), Immigrants from Afghanistan (47.2%, a difference of 0.010%), Immigrants from Sweden (47.2%, a difference of 0.040%), Immigrants from Greece (47.2%, a difference of 0.060%), and Immigrants from Argentina (47.2%, a difference of 0.060%).
| Demographics | Rating | Rank | Married-couple Households |
| Immigrants | Hungary | 87.8 /100 | #130 | Excellent 47.3% |
| Immigrants | Denmark | 87.5 /100 | #131 | Excellent 47.3% |
| Immigrants | Ukraine | 86.7 /100 | #132 | Excellent 47.3% |
| South Africans | 86.4 /100 | #133 | Excellent 47.3% |
| Immigrants | Greece | 86.0 /100 | #134 | Excellent 47.2% |
| Immigrants | Argentina | 86.0 /100 | #135 | Excellent 47.2% |
| New Zealanders | 85.3 /100 | #136 | Excellent 47.2% |
| Immigrants | Malaysia | 85.2 /100 | #137 | Excellent 47.2% |
| Immigrants | Afghanistan | 85.1 /100 | #138 | Excellent 47.2% |
| Immigrants | Sweden | 84.7 /100 | #139 | Excellent 47.2% |
| Spanish | 84.5 /100 | #140 | Excellent 47.2% |
| Costa Ricans | 84.4 /100 | #141 | Excellent 47.2% |
| Spaniards | 84.1 /100 | #142 | Excellent 47.2% |
| Immigrants | Belarus | 83.8 /100 | #143 | Excellent 47.2% |
| Mexicans | 83.4 /100 | #144 | Excellent 47.1% |