Immigrants from Burma/Myanmar vs New Zealander Family Households with Children
COMPARE
Immigrants from Burma/Myanmar
New Zealander
Family Households with Children
Family Households with Children Comparison
Immigrants from Burma/Myanmar
New Zealanders
28.0%
FAMILY HOUSEHOLDS WITH CHILDREN
97.7/ 100
METRIC RATING
108th/ 347
METRIC RANK
27.1%
FAMILY HOUSEHOLDS WITH CHILDREN
9.6/ 100
METRIC RATING
221st/ 347
METRIC RANK
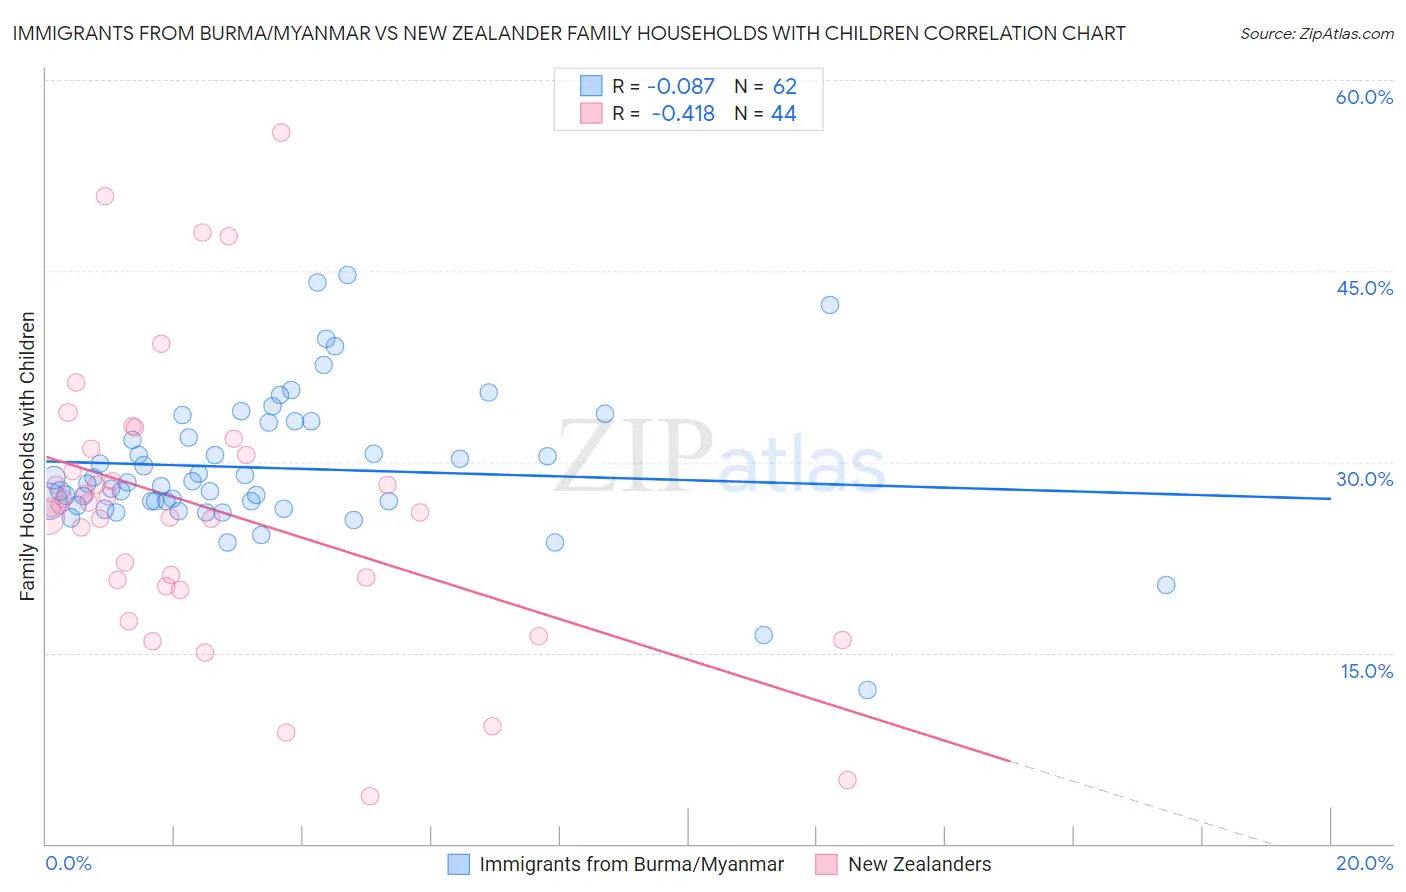
Immigrants from Burma/Myanmar vs New Zealander Family Households with Children Correlation Chart
The statistical analysis conducted on geographies consisting of 172,235,396 people shows a slight negative correlation between the proportion of Immigrants from Burma/Myanmar and percentage of family households with children in the United States with a correlation coefficient (R) of -0.087 and weighted average of 28.0%. Similarly, the statistical analysis conducted on geographies consisting of 106,880,294 people shows a moderate negative correlation between the proportion of New Zealanders and percentage of family households with children in the United States with a correlation coefficient (R) of -0.418 and weighted average of 27.1%, a difference of 3.3%.
Family Households with Children Correlation Summary
| Measurement | Immigrants from Burma/Myanmar | New Zealander |
| Minimum | 12.1% | 3.8% |
| Maximum | 44.7% | 55.8% |
| Range | 32.6% | 52.1% |
| Mean | 29.5% | 26.4% |
| Median | 28.3% | 26.6% |
| Interquartile 25% (IQ1) | 26.9% | 20.4% |
| Interquartile 75% (IQ3) | 33.1% | 30.8% |
| Interquartile Range (IQR) | 6.2% | 10.3% |
| Standard Deviation (Sample) | 5.7% | 11.0% |
| Standard Deviation (Population) | 5.6% | 10.8% |
Similar Demographics by Family Households with Children
Demographics Similar to Immigrants from Burma/Myanmar by Family Households with Children
In terms of family households with children, the demographic groups most similar to Immigrants from Burma/Myanmar are Immigrants from Uganda (28.0%, a difference of 0.010%), Tohono O'odham (28.0%, a difference of 0.010%), Spaniard (28.0%, a difference of 0.050%), Immigrants from South America (28.0%, a difference of 0.080%), and Scandinavian (28.0%, a difference of 0.11%).
| Demographics | Rating | Rank | Family Households with Children |
| Immigrants | Oceania | 98.8 /100 | #101 | Exceptional 28.1% |
| Assyrians/Chaldeans/Syriacs | 98.7 /100 | #102 | Exceptional 28.1% |
| Palestinians | 98.5 /100 | #103 | Exceptional 28.1% |
| Sioux | 98.3 /100 | #104 | Exceptional 28.1% |
| Choctaw | 98.3 /100 | #105 | Exceptional 28.1% |
| Immigrants | South America | 98.0 /100 | #106 | Exceptional 28.0% |
| Immigrants | Uganda | 97.7 /100 | #107 | Exceptional 28.0% |
| Immigrants | Burma/Myanmar | 97.7 /100 | #108 | Exceptional 28.0% |
| Tohono O'odham | 97.6 /100 | #109 | Exceptional 28.0% |
| Spaniards | 97.4 /100 | #110 | Exceptional 28.0% |
| Scandinavians | 97.1 /100 | #111 | Exceptional 28.0% |
| Immigrants | Middle Africa | 97.0 /100 | #112 | Exceptional 28.0% |
| Arabs | 97.0 /100 | #113 | Exceptional 28.0% |
| South American Indians | 96.9 /100 | #114 | Exceptional 28.0% |
| Immigrants | Africa | 96.8 /100 | #115 | Exceptional 28.0% |
Demographics Similar to New Zealanders by Family Households with Children
In terms of family households with children, the demographic groups most similar to New Zealanders are Paraguayan (27.1%, a difference of 0.010%), Austrian (27.1%, a difference of 0.020%), Pima (27.1%, a difference of 0.030%), German (27.1%, a difference of 0.060%), and Immigrants from Japan (27.1%, a difference of 0.070%).
| Demographics | Rating | Rank | Family Households with Children |
| Africans | 13.0 /100 | #214 | Poor 27.2% |
| Northern Europeans | 12.8 /100 | #215 | Poor 27.2% |
| Cubans | 12.2 /100 | #216 | Poor 27.1% |
| U.S. Virgin Islanders | 12.1 /100 | #217 | Poor 27.1% |
| Greeks | 11.4 /100 | #218 | Poor 27.1% |
| Immigrants | Japan | 10.7 /100 | #219 | Poor 27.1% |
| Austrians | 9.9 /100 | #220 | Tragic 27.1% |
| New Zealanders | 9.6 /100 | #221 | Tragic 27.1% |
| Paraguayans | 9.4 /100 | #222 | Tragic 27.1% |
| Pima | 9.2 /100 | #223 | Tragic 27.1% |
| Germans | 8.7 /100 | #224 | Tragic 27.1% |
| Canadians | 7.5 /100 | #225 | Tragic 27.1% |
| Czechoslovakians | 6.6 /100 | #226 | Tragic 27.0% |
| Tsimshian | 6.6 /100 | #227 | Tragic 27.0% |
| Scottish | 6.5 /100 | #228 | Tragic 27.0% |