British vs New Zealander Family Households with Children
COMPARE
British
New Zealander
Family Households with Children
Family Households with Children Comparison
British
New Zealanders
27.4%
FAMILY HOUSEHOLDS WITH CHILDREN
49.9/ 100
METRIC RATING
175th/ 347
METRIC RANK
27.1%
FAMILY HOUSEHOLDS WITH CHILDREN
9.6/ 100
METRIC RATING
221st/ 347
METRIC RANK
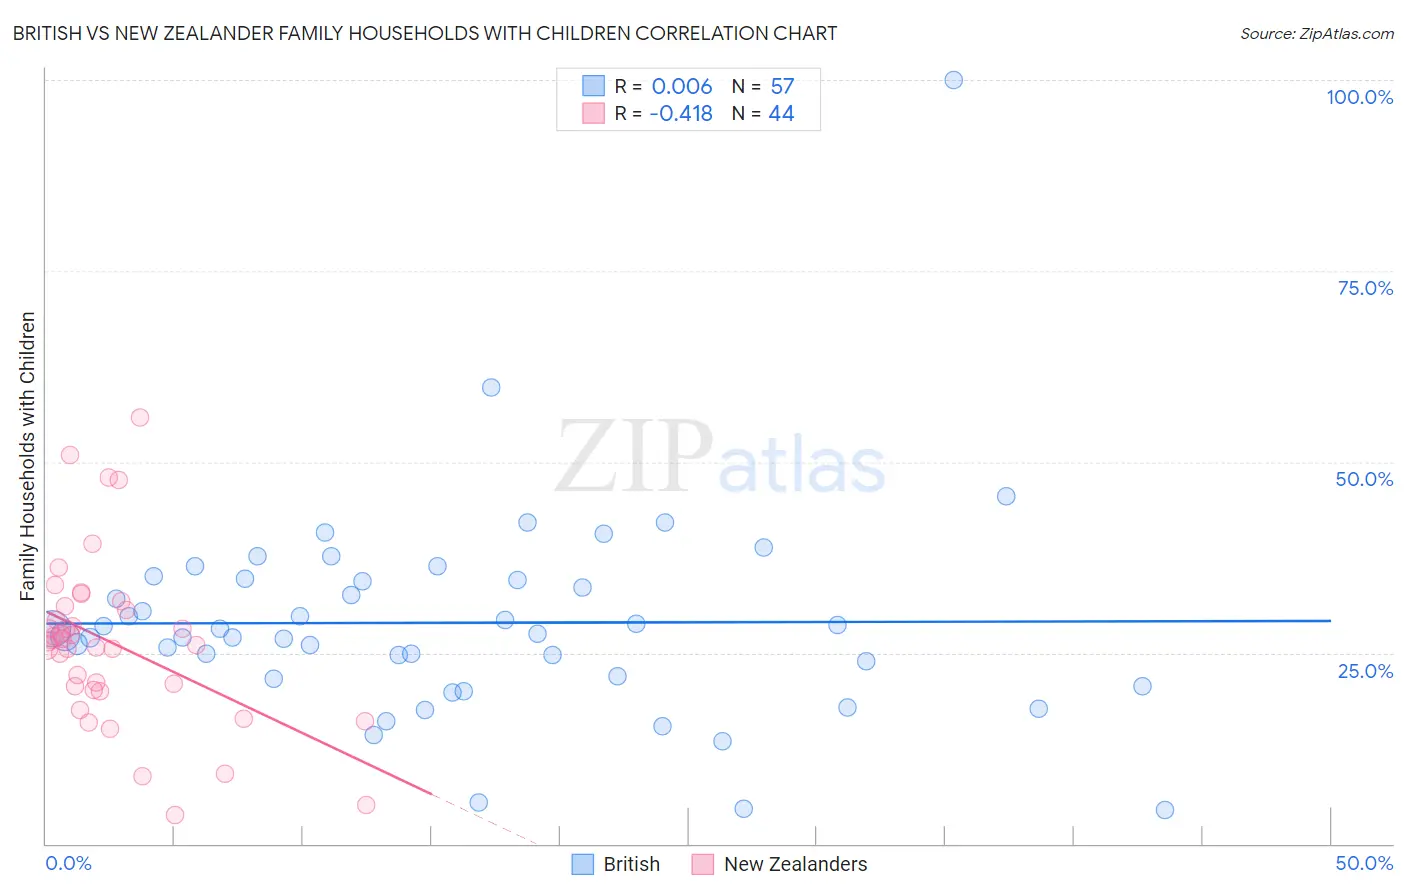
British vs New Zealander Family Households with Children Correlation Chart
The statistical analysis conducted on geographies consisting of 530,729,097 people shows no correlation between the proportion of British and percentage of family households with children in the United States with a correlation coefficient (R) of 0.006 and weighted average of 27.4%. Similarly, the statistical analysis conducted on geographies consisting of 106,880,294 people shows a moderate negative correlation between the proportion of New Zealanders and percentage of family households with children in the United States with a correlation coefficient (R) of -0.418 and weighted average of 27.1%, a difference of 1.3%.
Family Households with Children Correlation Summary
| Measurement | British | New Zealander |
| Minimum | 4.4% | 3.8% |
| Maximum | 100.0% | 55.8% |
| Range | 95.6% | 52.1% |
| Mean | 28.9% | 26.4% |
| Median | 27.6% | 26.6% |
| Interquartile 25% (IQ1) | 21.8% | 20.4% |
| Interquartile 75% (IQ3) | 34.6% | 30.8% |
| Interquartile Range (IQR) | 12.8% | 10.3% |
| Standard Deviation (Sample) | 13.9% | 11.0% |
| Standard Deviation (Population) | 13.8% | 10.8% |
Similar Demographics by Family Households with Children
Demographics Similar to British by Family Households with Children
In terms of family households with children, the demographic groups most similar to British are White/Caucasian (27.4%, a difference of 0.0%), Immigrants from China (27.4%, a difference of 0.010%), Ugandan (27.4%, a difference of 0.020%), Spanish American (27.4%, a difference of 0.020%), and Immigrants from Argentina (27.5%, a difference of 0.050%).
| Demographics | Rating | Rank | Family Households with Children |
| Immigrants | Kuwait | 60.9 /100 | #168 | Good 27.5% |
| Seminole | 56.9 /100 | #169 | Average 27.5% |
| Cherokee | 56.7 /100 | #170 | Average 27.5% |
| Blackfeet | 54.3 /100 | #171 | Average 27.5% |
| Israelis | 53.9 /100 | #172 | Average 27.5% |
| Immigrants | Argentina | 52.2 /100 | #173 | Average 27.5% |
| Whites/Caucasians | 50.0 /100 | #174 | Average 27.4% |
| British | 49.9 /100 | #175 | Average 27.4% |
| Immigrants | China | 49.6 /100 | #176 | Average 27.4% |
| Ugandans | 49.2 /100 | #177 | Average 27.4% |
| Spanish Americans | 48.9 /100 | #178 | Average 27.4% |
| Turks | 46.9 /100 | #179 | Average 27.4% |
| Immigrants | Turkey | 46.9 /100 | #180 | Average 27.4% |
| Aleuts | 46.7 /100 | #181 | Average 27.4% |
| Puget Sound Salish | 46.2 /100 | #182 | Average 27.4% |
Demographics Similar to New Zealanders by Family Households with Children
In terms of family households with children, the demographic groups most similar to New Zealanders are Paraguayan (27.1%, a difference of 0.010%), Austrian (27.1%, a difference of 0.020%), Pima (27.1%, a difference of 0.030%), German (27.1%, a difference of 0.060%), and Immigrants from Japan (27.1%, a difference of 0.070%).
| Demographics | Rating | Rank | Family Households with Children |
| Africans | 13.0 /100 | #214 | Poor 27.2% |
| Northern Europeans | 12.8 /100 | #215 | Poor 27.2% |
| Cubans | 12.2 /100 | #216 | Poor 27.1% |
| U.S. Virgin Islanders | 12.1 /100 | #217 | Poor 27.1% |
| Greeks | 11.4 /100 | #218 | Poor 27.1% |
| Immigrants | Japan | 10.7 /100 | #219 | Poor 27.1% |
| Austrians | 9.9 /100 | #220 | Tragic 27.1% |
| New Zealanders | 9.6 /100 | #221 | Tragic 27.1% |
| Paraguayans | 9.4 /100 | #222 | Tragic 27.1% |
| Pima | 9.2 /100 | #223 | Tragic 27.1% |
| Germans | 8.7 /100 | #224 | Tragic 27.1% |
| Canadians | 7.5 /100 | #225 | Tragic 27.1% |
| Czechoslovakians | 6.6 /100 | #226 | Tragic 27.0% |
| Tsimshian | 6.6 /100 | #227 | Tragic 27.0% |
| Scottish | 6.5 /100 | #228 | Tragic 27.0% |