Immigrants from Burma/Myanmar vs Immigrants from Denmark Family Households with Children
COMPARE
Immigrants from Burma/Myanmar
Immigrants from Denmark
Family Households with Children
Family Households with Children Comparison
Immigrants from Burma/Myanmar
Immigrants from Denmark
28.0%
FAMILY HOUSEHOLDS WITH CHILDREN
97.7/ 100
METRIC RATING
108th/ 347
METRIC RANK
26.7%
FAMILY HOUSEHOLDS WITH CHILDREN
0.8/ 100
METRIC RATING
269th/ 347
METRIC RANK
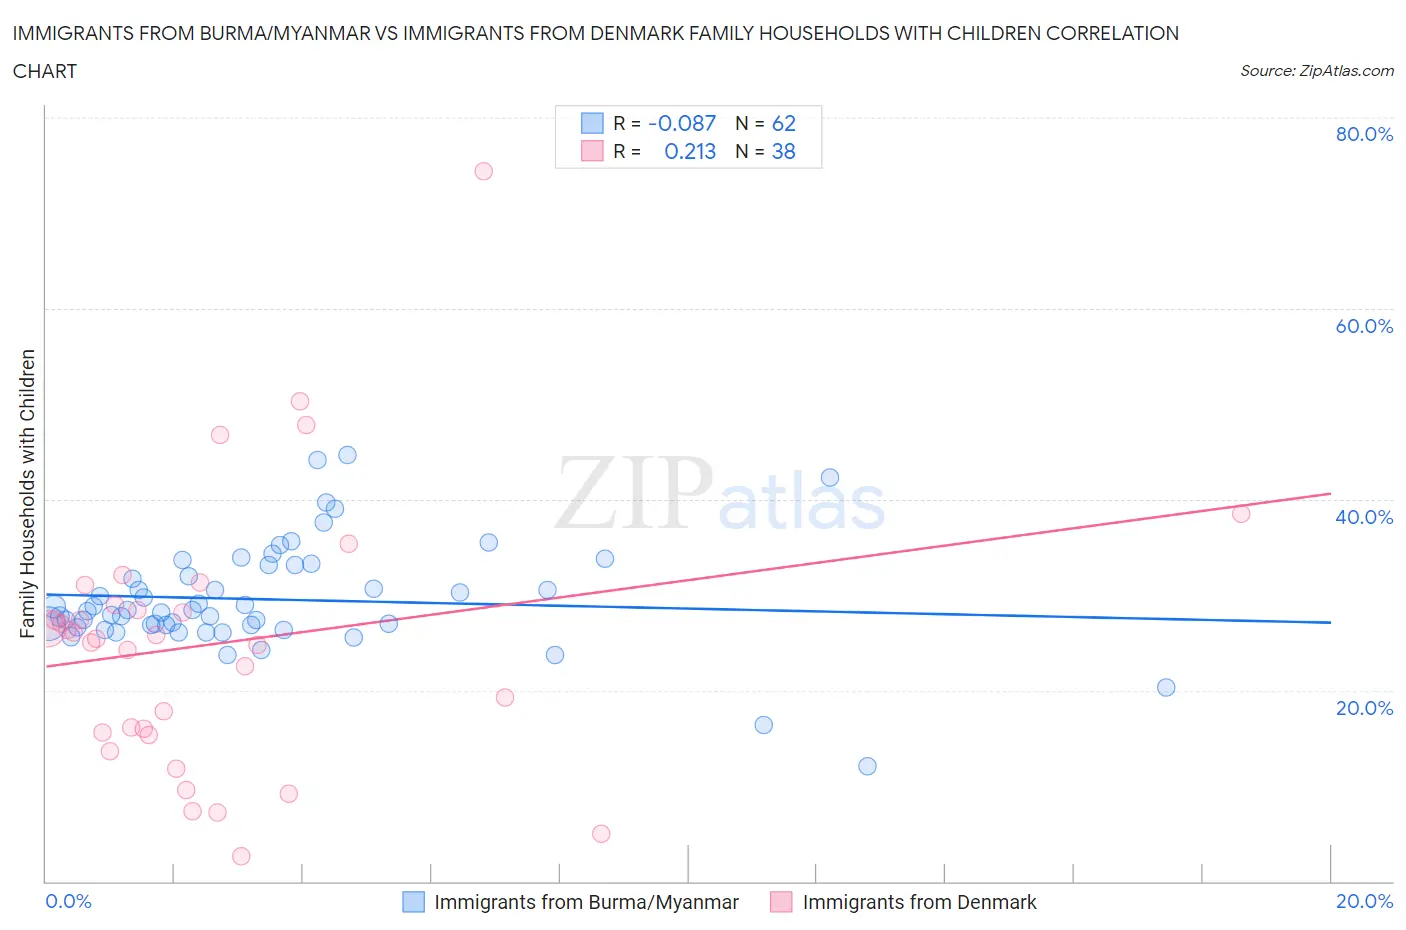
Immigrants from Burma/Myanmar vs Immigrants from Denmark Family Households with Children Correlation Chart
The statistical analysis conducted on geographies consisting of 172,235,396 people shows a slight negative correlation between the proportion of Immigrants from Burma/Myanmar and percentage of family households with children in the United States with a correlation coefficient (R) of -0.087 and weighted average of 28.0%. Similarly, the statistical analysis conducted on geographies consisting of 136,396,181 people shows a weak positive correlation between the proportion of Immigrants from Denmark and percentage of family households with children in the United States with a correlation coefficient (R) of 0.213 and weighted average of 26.7%, a difference of 4.8%.
Family Households with Children Correlation Summary
| Measurement | Immigrants from Burma/Myanmar | Immigrants from Denmark |
| Minimum | 12.1% | 2.6% |
| Maximum | 44.7% | 74.3% |
| Range | 32.6% | 71.7% |
| Mean | 29.5% | 24.9% |
| Median | 28.3% | 25.6% |
| Interquartile 25% (IQ1) | 26.9% | 15.6% |
| Interquartile 75% (IQ3) | 33.1% | 28.9% |
| Interquartile Range (IQR) | 6.2% | 13.3% |
| Standard Deviation (Sample) | 5.7% | 14.0% |
| Standard Deviation (Population) | 5.6% | 13.9% |
Similar Demographics by Family Households with Children
Demographics Similar to Immigrants from Burma/Myanmar by Family Households with Children
In terms of family households with children, the demographic groups most similar to Immigrants from Burma/Myanmar are Immigrants from Uganda (28.0%, a difference of 0.010%), Tohono O'odham (28.0%, a difference of 0.010%), Spaniard (28.0%, a difference of 0.050%), Immigrants from South America (28.0%, a difference of 0.080%), and Scandinavian (28.0%, a difference of 0.11%).
| Demographics | Rating | Rank | Family Households with Children |
| Immigrants | Oceania | 98.8 /100 | #101 | Exceptional 28.1% |
| Assyrians/Chaldeans/Syriacs | 98.7 /100 | #102 | Exceptional 28.1% |
| Palestinians | 98.5 /100 | #103 | Exceptional 28.1% |
| Sioux | 98.3 /100 | #104 | Exceptional 28.1% |
| Choctaw | 98.3 /100 | #105 | Exceptional 28.1% |
| Immigrants | South America | 98.0 /100 | #106 | Exceptional 28.0% |
| Immigrants | Uganda | 97.7 /100 | #107 | Exceptional 28.0% |
| Immigrants | Burma/Myanmar | 97.7 /100 | #108 | Exceptional 28.0% |
| Tohono O'odham | 97.6 /100 | #109 | Exceptional 28.0% |
| Spaniards | 97.4 /100 | #110 | Exceptional 28.0% |
| Scandinavians | 97.1 /100 | #111 | Exceptional 28.0% |
| Immigrants | Middle Africa | 97.0 /100 | #112 | Exceptional 28.0% |
| Arabs | 97.0 /100 | #113 | Exceptional 28.0% |
| South American Indians | 96.9 /100 | #114 | Exceptional 28.0% |
| Immigrants | Africa | 96.8 /100 | #115 | Exceptional 28.0% |
Demographics Similar to Immigrants from Denmark by Family Households with Children
In terms of family households with children, the demographic groups most similar to Immigrants from Denmark are Immigrants from Belgium (26.7%, a difference of 0.040%), Immigrants from Uzbekistan (26.7%, a difference of 0.050%), Immigrants from Zaire (26.7%, a difference of 0.050%), Chippewa (26.7%, a difference of 0.060%), and Maltese (26.7%, a difference of 0.060%).
| Demographics | Rating | Rank | Family Households with Children |
| Immigrants | Russia | 1.0 /100 | #262 | Tragic 26.8% |
| Immigrants | North Macedonia | 1.0 /100 | #263 | Tragic 26.7% |
| Taiwanese | 0.9 /100 | #264 | Tragic 26.7% |
| Chippewa | 0.9 /100 | #265 | Tragic 26.7% |
| Maltese | 0.9 /100 | #266 | Tragic 26.7% |
| Immigrants | Uzbekistan | 0.9 /100 | #267 | Tragic 26.7% |
| Immigrants | Belgium | 0.9 /100 | #268 | Tragic 26.7% |
| Immigrants | Denmark | 0.8 /100 | #269 | Tragic 26.7% |
| Immigrants | Zaire | 0.7 /100 | #270 | Tragic 26.7% |
| French | 0.7 /100 | #271 | Tragic 26.7% |
| Somalis | 0.7 /100 | #272 | Tragic 26.7% |
| Immigrants | Hungary | 0.6 /100 | #273 | Tragic 26.7% |
| Eastern Europeans | 0.6 /100 | #274 | Tragic 26.7% |
| Immigrants | Northern Europe | 0.5 /100 | #275 | Tragic 26.7% |
| Immigrants | Spain | 0.5 /100 | #276 | Tragic 26.6% |