Finnish vs New Zealander Family Households with Children
COMPARE
Finnish
New Zealander
Family Households with Children
Family Households with Children Comparison
Finns
New Zealanders
26.6%
FAMILY HOUSEHOLDS WITH CHILDREN
0.4/ 100
METRIC RATING
279th/ 347
METRIC RANK
27.1%
FAMILY HOUSEHOLDS WITH CHILDREN
9.6/ 100
METRIC RATING
221st/ 347
METRIC RANK
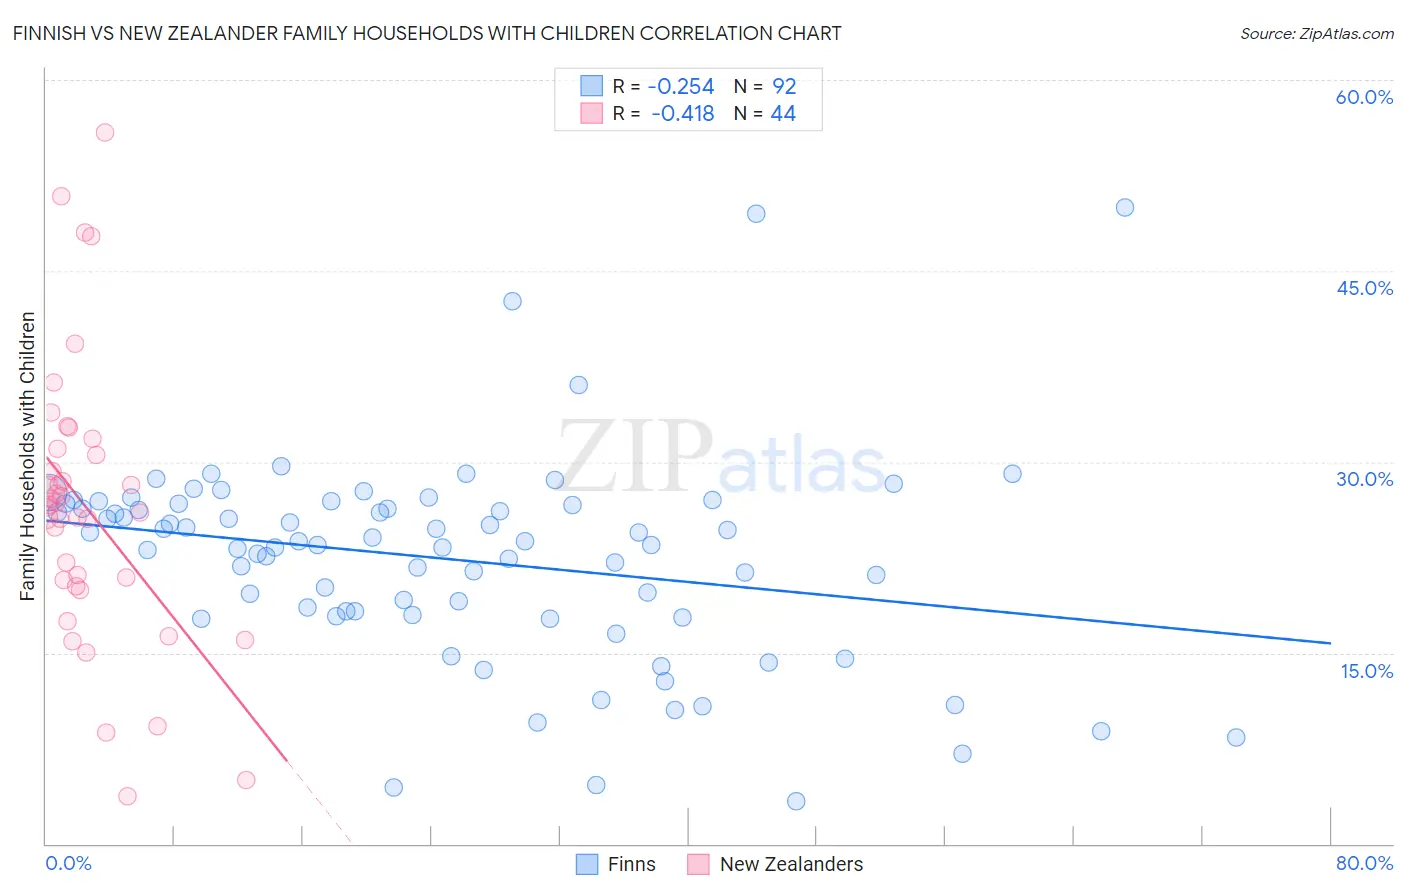
Finnish vs New Zealander Family Households with Children Correlation Chart
The statistical analysis conducted on geographies consisting of 404,347,048 people shows a weak negative correlation between the proportion of Finns and percentage of family households with children in the United States with a correlation coefficient (R) of -0.254 and weighted average of 26.6%. Similarly, the statistical analysis conducted on geographies consisting of 106,880,294 people shows a moderate negative correlation between the proportion of New Zealanders and percentage of family households with children in the United States with a correlation coefficient (R) of -0.418 and weighted average of 27.1%, a difference of 1.9%.
Family Households with Children Correlation Summary
| Measurement | Finnish | New Zealander |
| Minimum | 3.3% | 3.8% |
| Maximum | 50.0% | 55.8% |
| Range | 46.7% | 52.1% |
| Mean | 22.4% | 26.4% |
| Median | 23.6% | 26.6% |
| Interquartile 25% (IQ1) | 18.1% | 20.4% |
| Interquartile 75% (IQ3) | 26.7% | 30.8% |
| Interquartile Range (IQR) | 8.6% | 10.3% |
| Standard Deviation (Sample) | 8.0% | 11.0% |
| Standard Deviation (Population) | 8.0% | 10.8% |
Similar Demographics by Family Households with Children
Demographics Similar to Finns by Family Households with Children
In terms of family households with children, the demographic groups most similar to Finns are Immigrants from Europe (26.6%, a difference of 0.020%), Senegalese (26.6%, a difference of 0.020%), Celtic (26.6%, a difference of 0.080%), Lithuanian (26.6%, a difference of 0.12%), and French American Indian (26.6%, a difference of 0.13%).
| Demographics | Rating | Rank | Family Households with Children |
| Somalis | 0.7 /100 | #272 | Tragic 26.7% |
| Immigrants | Hungary | 0.6 /100 | #273 | Tragic 26.7% |
| Eastern Europeans | 0.6 /100 | #274 | Tragic 26.7% |
| Immigrants | Northern Europe | 0.5 /100 | #275 | Tragic 26.7% |
| Immigrants | Spain | 0.5 /100 | #276 | Tragic 26.6% |
| Celtics | 0.4 /100 | #277 | Tragic 26.6% |
| Immigrants | Europe | 0.4 /100 | #278 | Tragic 26.6% |
| Finns | 0.4 /100 | #279 | Tragic 26.6% |
| Senegalese | 0.4 /100 | #280 | Tragic 26.6% |
| Lithuanians | 0.3 /100 | #281 | Tragic 26.6% |
| French American Indians | 0.3 /100 | #282 | Tragic 26.6% |
| Immigrants | North America | 0.3 /100 | #283 | Tragic 26.6% |
| Immigrants | Canada | 0.3 /100 | #284 | Tragic 26.5% |
| Cambodians | 0.2 /100 | #285 | Tragic 26.5% |
| Immigrants | Senegal | 0.2 /100 | #286 | Tragic 26.5% |
Demographics Similar to New Zealanders by Family Households with Children
In terms of family households with children, the demographic groups most similar to New Zealanders are Paraguayan (27.1%, a difference of 0.010%), Austrian (27.1%, a difference of 0.020%), Pima (27.1%, a difference of 0.030%), German (27.1%, a difference of 0.060%), and Immigrants from Japan (27.1%, a difference of 0.070%).
| Demographics | Rating | Rank | Family Households with Children |
| Africans | 13.0 /100 | #214 | Poor 27.2% |
| Northern Europeans | 12.8 /100 | #215 | Poor 27.2% |
| Cubans | 12.2 /100 | #216 | Poor 27.1% |
| U.S. Virgin Islanders | 12.1 /100 | #217 | Poor 27.1% |
| Greeks | 11.4 /100 | #218 | Poor 27.1% |
| Immigrants | Japan | 10.7 /100 | #219 | Poor 27.1% |
| Austrians | 9.9 /100 | #220 | Tragic 27.1% |
| New Zealanders | 9.6 /100 | #221 | Tragic 27.1% |
| Paraguayans | 9.4 /100 | #222 | Tragic 27.1% |
| Pima | 9.2 /100 | #223 | Tragic 27.1% |
| Germans | 8.7 /100 | #224 | Tragic 27.1% |
| Canadians | 7.5 /100 | #225 | Tragic 27.1% |
| Czechoslovakians | 6.6 /100 | #226 | Tragic 27.0% |
| Tsimshian | 6.6 /100 | #227 | Tragic 27.0% |
| Scottish | 6.5 /100 | #228 | Tragic 27.0% |