Immigrants from Burma/Myanmar vs Puerto Rican Family Households with Children
COMPARE
Immigrants from Burma/Myanmar
Puerto Rican
Family Households with Children
Family Households with Children Comparison
Immigrants from Burma/Myanmar
Puerto Ricans
28.0%
FAMILY HOUSEHOLDS WITH CHILDREN
97.7/ 100
METRIC RATING
108th/ 347
METRIC RANK
25.6%
FAMILY HOUSEHOLDS WITH CHILDREN
0.0/ 100
METRIC RATING
337th/ 347
METRIC RANK
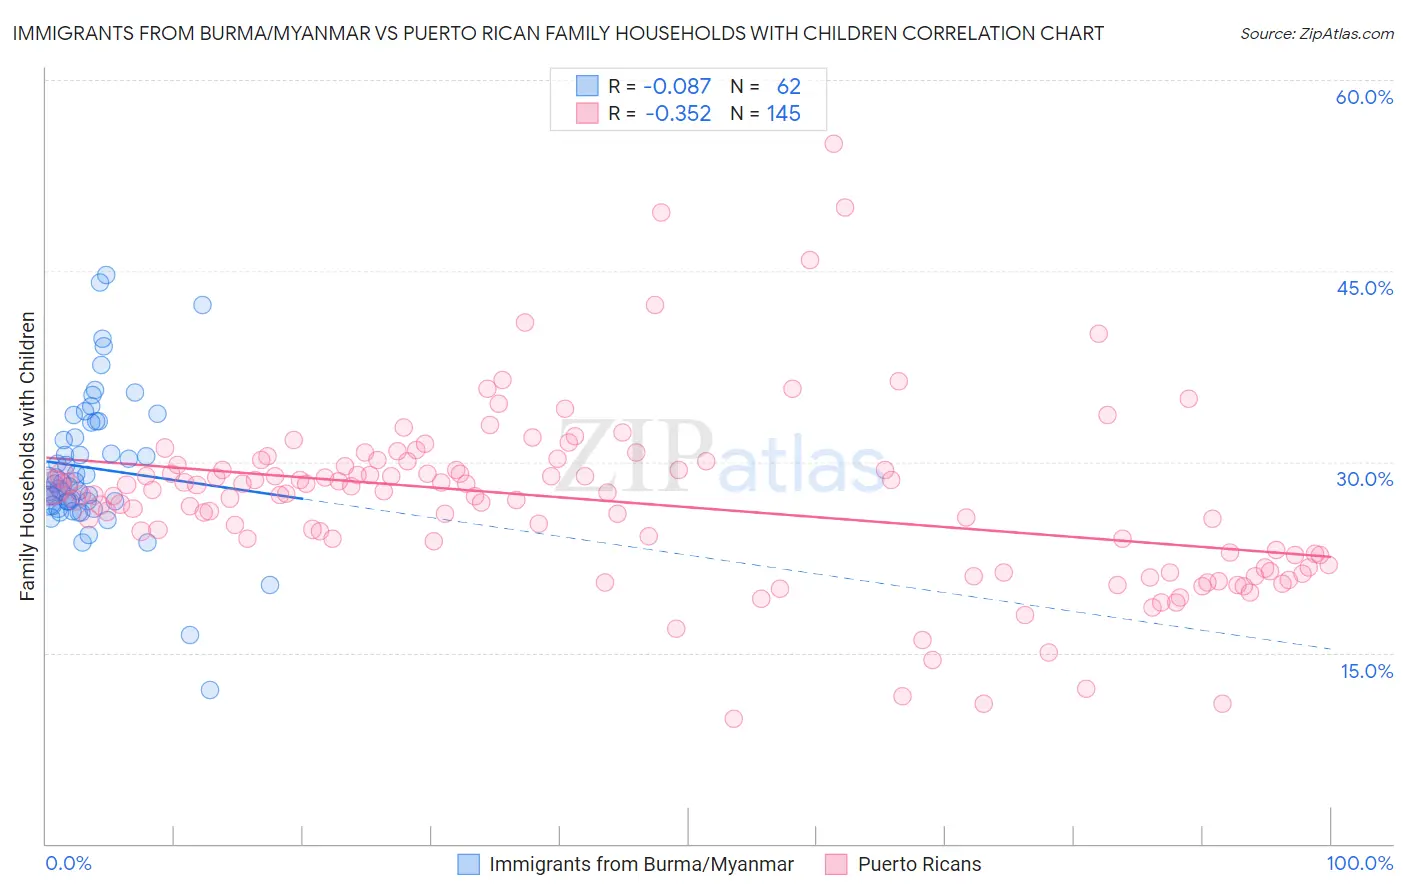
Immigrants from Burma/Myanmar vs Puerto Rican Family Households with Children Correlation Chart
The statistical analysis conducted on geographies consisting of 172,235,396 people shows a slight negative correlation between the proportion of Immigrants from Burma/Myanmar and percentage of family households with children in the United States with a correlation coefficient (R) of -0.087 and weighted average of 28.0%. Similarly, the statistical analysis conducted on geographies consisting of 527,477,936 people shows a mild negative correlation between the proportion of Puerto Ricans and percentage of family households with children in the United States with a correlation coefficient (R) of -0.352 and weighted average of 25.6%, a difference of 9.5%.
Family Households with Children Correlation Summary
| Measurement | Immigrants from Burma/Myanmar | Puerto Rican |
| Minimum | 12.1% | 9.8% |
| Maximum | 44.7% | 54.9% |
| Range | 32.6% | 45.1% |
| Mean | 29.5% | 26.9% |
| Median | 28.3% | 27.4% |
| Interquartile 25% (IQ1) | 26.9% | 22.3% |
| Interquartile 75% (IQ3) | 33.1% | 29.5% |
| Interquartile Range (IQR) | 6.2% | 7.3% |
| Standard Deviation (Sample) | 5.7% | 6.9% |
| Standard Deviation (Population) | 5.6% | 6.9% |
Similar Demographics by Family Households with Children
Demographics Similar to Immigrants from Burma/Myanmar by Family Households with Children
In terms of family households with children, the demographic groups most similar to Immigrants from Burma/Myanmar are Immigrants from Uganda (28.0%, a difference of 0.010%), Tohono O'odham (28.0%, a difference of 0.010%), Spaniard (28.0%, a difference of 0.050%), Immigrants from South America (28.0%, a difference of 0.080%), and Scandinavian (28.0%, a difference of 0.11%).
| Demographics | Rating | Rank | Family Households with Children |
| Immigrants | Oceania | 98.8 /100 | #101 | Exceptional 28.1% |
| Assyrians/Chaldeans/Syriacs | 98.7 /100 | #102 | Exceptional 28.1% |
| Palestinians | 98.5 /100 | #103 | Exceptional 28.1% |
| Sioux | 98.3 /100 | #104 | Exceptional 28.1% |
| Choctaw | 98.3 /100 | #105 | Exceptional 28.1% |
| Immigrants | South America | 98.0 /100 | #106 | Exceptional 28.0% |
| Immigrants | Uganda | 97.7 /100 | #107 | Exceptional 28.0% |
| Immigrants | Burma/Myanmar | 97.7 /100 | #108 | Exceptional 28.0% |
| Tohono O'odham | 97.6 /100 | #109 | Exceptional 28.0% |
| Spaniards | 97.4 /100 | #110 | Exceptional 28.0% |
| Scandinavians | 97.1 /100 | #111 | Exceptional 28.0% |
| Immigrants | Middle Africa | 97.0 /100 | #112 | Exceptional 28.0% |
| Arabs | 97.0 /100 | #113 | Exceptional 28.0% |
| South American Indians | 96.9 /100 | #114 | Exceptional 28.0% |
| Immigrants | Africa | 96.8 /100 | #115 | Exceptional 28.0% |
Demographics Similar to Puerto Ricans by Family Households with Children
In terms of family households with children, the demographic groups most similar to Puerto Ricans are Arapaho (25.6%, a difference of 0.030%), Immigrants from St. Vincent and the Grenadines (25.6%, a difference of 0.040%), Immigrants from Armenia (25.6%, a difference of 0.080%), Immigrants from West Indies (25.7%, a difference of 0.39%), and Immigrants from Serbia (25.5%, a difference of 0.46%).
| Demographics | Rating | Rank | Family Households with Children |
| Immigrants | Latvia | 0.0 /100 | #330 | Tragic 25.9% |
| Slovenes | 0.0 /100 | #331 | Tragic 25.8% |
| Immigrants | Austria | 0.0 /100 | #332 | Tragic 25.8% |
| Immigrants | Switzerland | 0.0 /100 | #333 | Tragic 25.7% |
| Slovaks | 0.0 /100 | #334 | Tragic 25.7% |
| Immigrants | Croatia | 0.0 /100 | #335 | Tragic 25.7% |
| Immigrants | West Indies | 0.0 /100 | #336 | Tragic 25.7% |
| Puerto Ricans | 0.0 /100 | #337 | Tragic 25.6% |
| Arapaho | 0.0 /100 | #338 | Tragic 25.6% |
| Immigrants | St. Vincent and the Grenadines | 0.0 /100 | #339 | Tragic 25.6% |
| Immigrants | Armenia | 0.0 /100 | #340 | Tragic 25.6% |
| Immigrants | Serbia | 0.0 /100 | #341 | Tragic 25.5% |
| Alsatians | 0.0 /100 | #342 | Tragic 25.3% |
| Hopi | 0.0 /100 | #343 | Tragic 25.2% |
| Pueblo | 0.0 /100 | #344 | Tragic 25.2% |