Ukrainian vs New Zealander Family Households with Children
COMPARE
Ukrainian
New Zealander
Family Households with Children
Family Households with Children Comparison
Ukrainians
New Zealanders
26.9%
FAMILY HOUSEHOLDS WITH CHILDREN
2.9/ 100
METRIC RATING
244th/ 347
METRIC RANK
27.1%
FAMILY HOUSEHOLDS WITH CHILDREN
9.6/ 100
METRIC RATING
221st/ 347
METRIC RANK
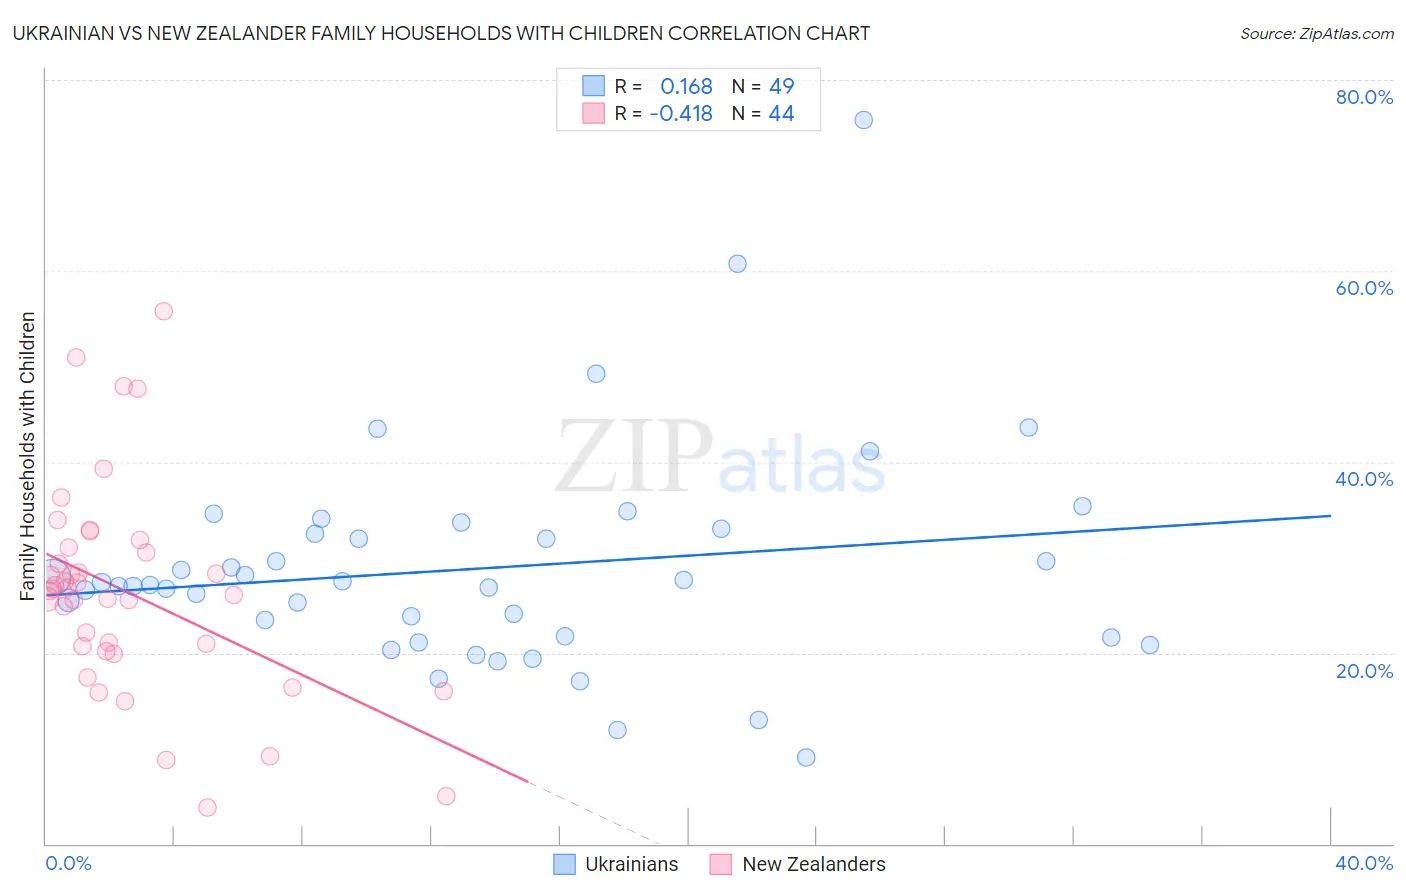
Ukrainian vs New Zealander Family Households with Children Correlation Chart
The statistical analysis conducted on geographies consisting of 448,081,438 people shows a poor positive correlation between the proportion of Ukrainians and percentage of family households with children in the United States with a correlation coefficient (R) of 0.168 and weighted average of 26.9%. Similarly, the statistical analysis conducted on geographies consisting of 106,880,294 people shows a moderate negative correlation between the proportion of New Zealanders and percentage of family households with children in the United States with a correlation coefficient (R) of -0.418 and weighted average of 27.1%, a difference of 0.72%.
Family Households with Children Correlation Summary
| Measurement | Ukrainian | New Zealander |
| Minimum | 9.0% | 3.8% |
| Maximum | 75.9% | 55.8% |
| Range | 66.8% | 52.1% |
| Mean | 28.8% | 26.4% |
| Median | 27.1% | 26.6% |
| Interquartile 25% (IQ1) | 21.7% | 20.4% |
| Interquartile 75% (IQ3) | 32.7% | 30.8% |
| Interquartile Range (IQR) | 11.1% | 10.3% |
| Standard Deviation (Sample) | 11.5% | 11.0% |
| Standard Deviation (Population) | 11.4% | 10.8% |
Similar Demographics by Family Households with Children
Demographics Similar to Ukrainians by Family Households with Children
In terms of family households with children, the demographic groups most similar to Ukrainians are Immigrants from Saudi Arabia (26.9%, a difference of 0.010%), Australian (26.9%, a difference of 0.020%), Navajo (26.9%, a difference of 0.070%), Immigrants from England (26.9%, a difference of 0.070%), and Immigrants from Bulgaria (26.9%, a difference of 0.080%).
| Demographics | Rating | Rank | Family Households with Children |
| Immigrants | Netherlands | 3.5 /100 | #237 | Tragic 26.9% |
| Moroccans | 3.4 /100 | #238 | Tragic 26.9% |
| Immigrants | Southern Europe | 3.4 /100 | #239 | Tragic 26.9% |
| Immigrants | Bulgaria | 3.3 /100 | #240 | Tragic 26.9% |
| Navajo | 3.2 /100 | #241 | Tragic 26.9% |
| Immigrants | England | 3.2 /100 | #242 | Tragic 26.9% |
| Immigrants | Saudi Arabia | 2.9 /100 | #243 | Tragic 26.9% |
| Ukrainians | 2.9 /100 | #244 | Tragic 26.9% |
| Australians | 2.8 /100 | #245 | Tragic 26.9% |
| Jamaicans | 2.5 /100 | #246 | Tragic 26.9% |
| Potawatomi | 2.2 /100 | #247 | Tragic 26.9% |
| Immigrants | Kazakhstan | 2.2 /100 | #248 | Tragic 26.9% |
| Immigrants | Eastern Europe | 2.1 /100 | #249 | Tragic 26.9% |
| Belgians | 2.1 /100 | #250 | Tragic 26.9% |
| Immigrants | Bosnia and Herzegovina | 1.9 /100 | #251 | Tragic 26.8% |
Demographics Similar to New Zealanders by Family Households with Children
In terms of family households with children, the demographic groups most similar to New Zealanders are Paraguayan (27.1%, a difference of 0.010%), Austrian (27.1%, a difference of 0.020%), Pima (27.1%, a difference of 0.030%), German (27.1%, a difference of 0.060%), and Immigrants from Japan (27.1%, a difference of 0.070%).
| Demographics | Rating | Rank | Family Households with Children |
| Africans | 13.0 /100 | #214 | Poor 27.2% |
| Northern Europeans | 12.8 /100 | #215 | Poor 27.2% |
| Cubans | 12.2 /100 | #216 | Poor 27.1% |
| U.S. Virgin Islanders | 12.1 /100 | #217 | Poor 27.1% |
| Greeks | 11.4 /100 | #218 | Poor 27.1% |
| Immigrants | Japan | 10.7 /100 | #219 | Poor 27.1% |
| Austrians | 9.9 /100 | #220 | Tragic 27.1% |
| New Zealanders | 9.6 /100 | #221 | Tragic 27.1% |
| Paraguayans | 9.4 /100 | #222 | Tragic 27.1% |
| Pima | 9.2 /100 | #223 | Tragic 27.1% |
| Germans | 8.7 /100 | #224 | Tragic 27.1% |
| Canadians | 7.5 /100 | #225 | Tragic 27.1% |
| Czechoslovakians | 6.6 /100 | #226 | Tragic 27.0% |
| Tsimshian | 6.6 /100 | #227 | Tragic 27.0% |
| Scottish | 6.5 /100 | #228 | Tragic 27.0% |