Immigrants from Brazil vs Arab Births to Unmarried Women
COMPARE
Immigrants from Brazil
Arab
Births to Unmarried Women
Births to Unmarried Women Comparison
Immigrants from Brazil
Arabs
29.6%
BIRTHS TO UNMARRIED WOMEN
93.7/ 100
METRIC RATING
107th/ 347
METRIC RANK
29.2%
BIRTHS TO UNMARRIED WOMEN
96.5/ 100
METRIC RATING
92nd/ 347
METRIC RANK
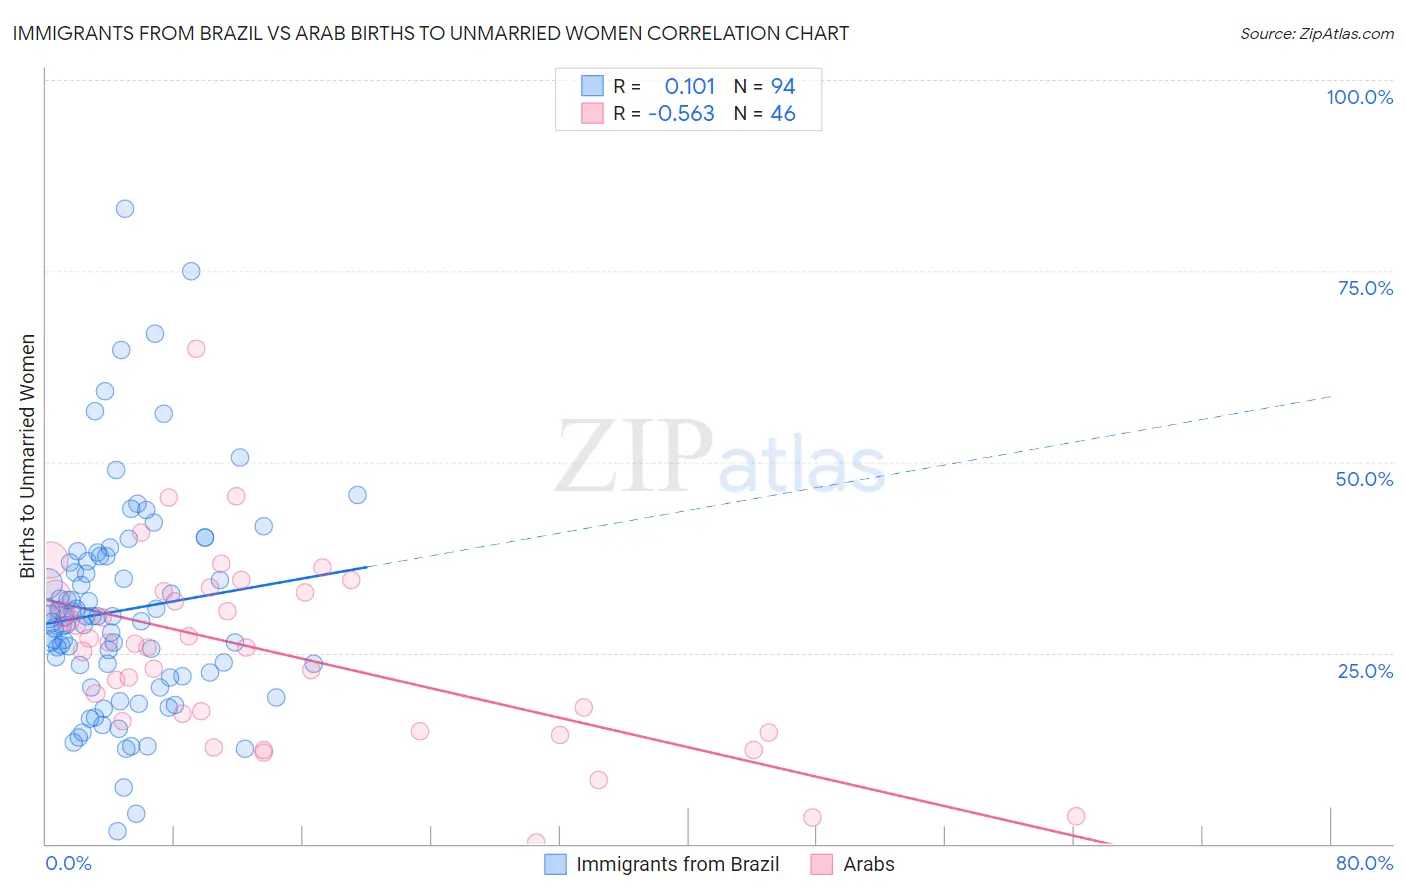
Immigrants from Brazil vs Arab Births to Unmarried Women Correlation Chart
The statistical analysis conducted on geographies consisting of 321,610,607 people shows a poor positive correlation between the proportion of Immigrants from Brazil and percentage of births to unmarried women in the United States with a correlation coefficient (R) of 0.101 and weighted average of 29.6%. Similarly, the statistical analysis conducted on geographies consisting of 447,045,945 people shows a substantial negative correlation between the proportion of Arabs and percentage of births to unmarried women in the United States with a correlation coefficient (R) of -0.563 and weighted average of 29.2%, a difference of 1.6%.
Births to Unmarried Women Correlation Summary
| Measurement | Immigrants from Brazil | Arab |
| Minimum | 1.6% | 0.20% |
| Maximum | 83.2% | 64.9% |
| Range | 81.6% | 64.7% |
| Mean | 30.6% | 25.1% |
| Median | 29.4% | 26.0% |
| Interquartile 25% (IQ1) | 22.0% | 16.0% |
| Interquartile 75% (IQ3) | 36.9% | 32.9% |
| Interquartile Range (IQR) | 14.9% | 16.9% |
| Standard Deviation (Sample) | 14.2% | 12.3% |
| Standard Deviation (Population) | 14.1% | 12.2% |
Demographics Similar to Immigrants from Brazil and Arabs by Births to Unmarried Women
In terms of births to unmarried women, the demographic groups most similar to Immigrants from Brazil are Swedish (29.6%, a difference of 0.010%), Paraguayan (29.7%, a difference of 0.090%), Greek (29.7%, a difference of 0.12%), Immigrants from Nepal (29.6%, a difference of 0.27%), and Lithuanian (29.6%, a difference of 0.32%). Similarly, the demographic groups most similar to Arabs are Immigrants from Fiji (29.2%, a difference of 0.040%), Estonian (29.2%, a difference of 0.040%), Ukrainian (29.2%, a difference of 0.16%), Immigrants from Latvia (29.1%, a difference of 0.25%), and Immigrants from Vietnam (29.3%, a difference of 0.30%).
| Demographics | Rating | Rank | Births to Unmarried Women |
| Immigrants | Saudi Arabia | 97.0 /100 | #89 | Exceptional 29.1% |
| Immigrants | Latvia | 96.8 /100 | #90 | Exceptional 29.1% |
| Immigrants | Fiji | 96.6 /100 | #91 | Exceptional 29.2% |
| Arabs | 96.5 /100 | #92 | Exceptional 29.2% |
| Estonians | 96.5 /100 | #93 | Exceptional 29.2% |
| Ukrainians | 96.3 /100 | #94 | Exceptional 29.2% |
| Immigrants | Vietnam | 96.1 /100 | #95 | Exceptional 29.3% |
| Norwegians | 95.8 /100 | #96 | Exceptional 29.3% |
| Immigrants | South Africa | 95.7 /100 | #97 | Exceptional 29.3% |
| Immigrants | Syria | 95.7 /100 | #98 | Exceptional 29.4% |
| Immigrants | Denmark | 95.3 /100 | #99 | Exceptional 29.4% |
| Luxembourgers | 95.2 /100 | #100 | Exceptional 29.4% |
| Immigrants | Northern Africa | 94.7 /100 | #101 | Exceptional 29.5% |
| Australians | 94.6 /100 | #102 | Exceptional 29.5% |
| Lebanese | 94.4 /100 | #103 | Exceptional 29.5% |
| Lithuanians | 94.4 /100 | #104 | Exceptional 29.6% |
| Immigrants | Nepal | 94.3 /100 | #105 | Exceptional 29.6% |
| Swedes | 93.8 /100 | #106 | Exceptional 29.6% |
| Immigrants | Brazil | 93.7 /100 | #107 | Exceptional 29.6% |
| Paraguayans | 93.5 /100 | #108 | Exceptional 29.7% |
| Greeks | 93.4 /100 | #109 | Exceptional 29.7% |