Immigrants from Brazil vs Seminole Births to Unmarried Women
COMPARE
Immigrants from Brazil
Seminole
Births to Unmarried Women
Births to Unmarried Women Comparison
Immigrants from Brazil
Seminole
29.6%
BIRTHS TO UNMARRIED WOMEN
93.7/ 100
METRIC RATING
107th/ 347
METRIC RANK
37.9%
BIRTHS TO UNMARRIED WOMEN
0.0/ 100
METRIC RATING
291st/ 347
METRIC RANK
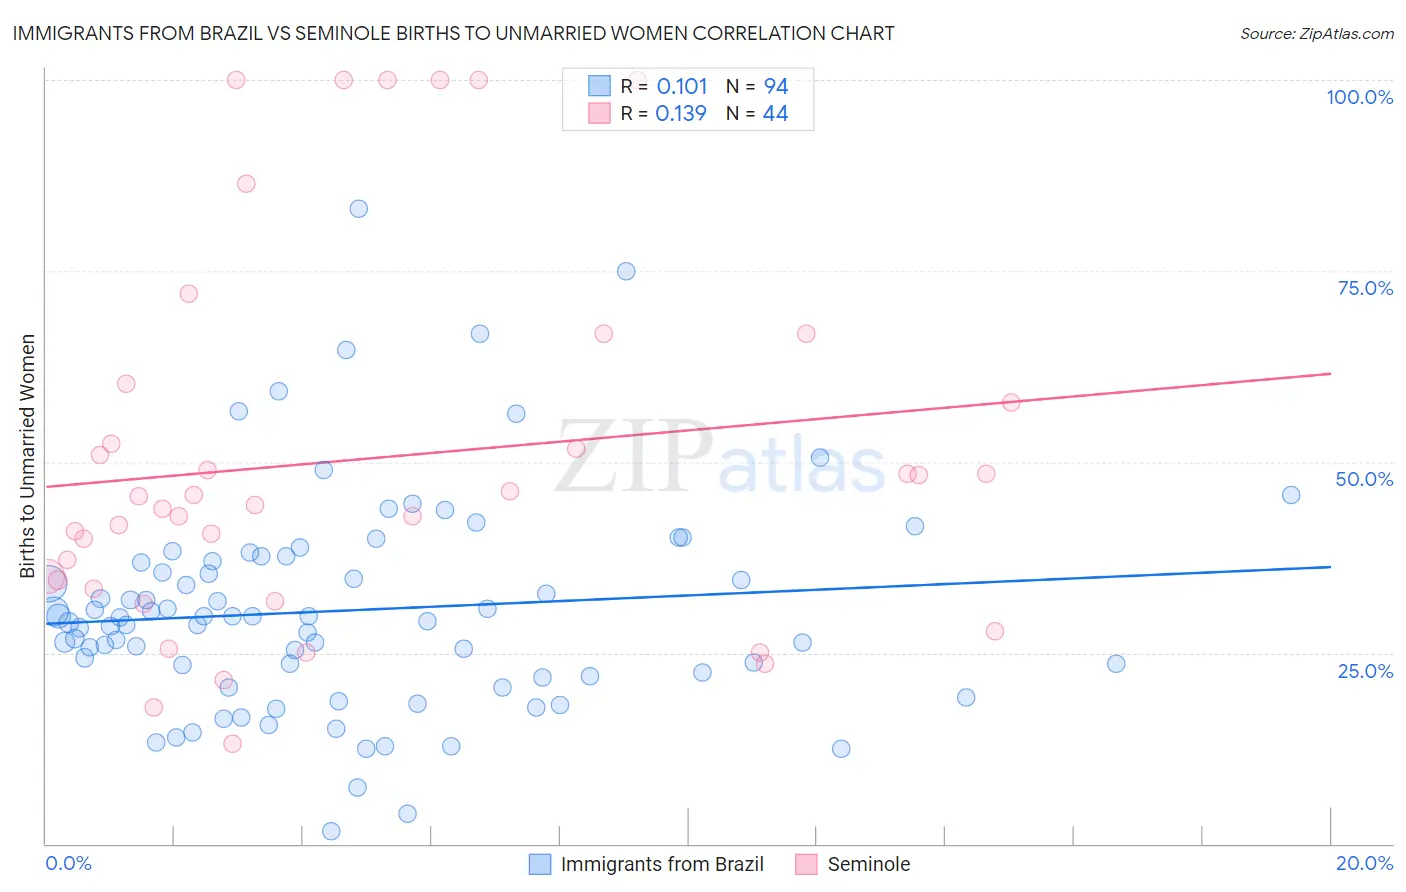
Immigrants from Brazil vs Seminole Births to Unmarried Women Correlation Chart
The statistical analysis conducted on geographies consisting of 321,610,607 people shows a poor positive correlation between the proportion of Immigrants from Brazil and percentage of births to unmarried women in the United States with a correlation coefficient (R) of 0.101 and weighted average of 29.6%. Similarly, the statistical analysis conducted on geographies consisting of 116,507,450 people shows a poor positive correlation between the proportion of Seminole and percentage of births to unmarried women in the United States with a correlation coefficient (R) of 0.139 and weighted average of 37.9%, a difference of 27.8%.
Births to Unmarried Women Correlation Summary
| Measurement | Immigrants from Brazil | Seminole |
| Minimum | 1.6% | 13.1% |
| Maximum | 83.2% | 100.0% |
| Range | 81.6% | 86.9% |
| Mean | 30.6% | 50.4% |
| Median | 29.4% | 45.0% |
| Interquartile 25% (IQ1) | 22.0% | 34.0% |
| Interquartile 75% (IQ3) | 36.9% | 59.0% |
| Interquartile Range (IQR) | 14.9% | 25.0% |
| Standard Deviation (Sample) | 14.2% | 24.6% |
| Standard Deviation (Population) | 14.1% | 24.3% |
Similar Demographics by Births to Unmarried Women
Demographics Similar to Immigrants from Brazil by Births to Unmarried Women
In terms of births to unmarried women, the demographic groups most similar to Immigrants from Brazil are Swedish (29.6%, a difference of 0.010%), Paraguayan (29.7%, a difference of 0.090%), Greek (29.7%, a difference of 0.12%), Immigrants from Ethiopia (29.7%, a difference of 0.15%), and Immigrants from Nepal (29.6%, a difference of 0.27%).
| Demographics | Rating | Rank | Births to Unmarried Women |
| Luxembourgers | 95.2 /100 | #100 | Exceptional 29.4% |
| Immigrants | Northern Africa | 94.7 /100 | #101 | Exceptional 29.5% |
| Australians | 94.6 /100 | #102 | Exceptional 29.5% |
| Lebanese | 94.4 /100 | #103 | Exceptional 29.5% |
| Lithuanians | 94.4 /100 | #104 | Exceptional 29.6% |
| Immigrants | Nepal | 94.3 /100 | #105 | Exceptional 29.6% |
| Swedes | 93.8 /100 | #106 | Exceptional 29.6% |
| Immigrants | Brazil | 93.7 /100 | #107 | Exceptional 29.6% |
| Paraguayans | 93.5 /100 | #108 | Exceptional 29.7% |
| Greeks | 93.4 /100 | #109 | Exceptional 29.7% |
| Immigrants | Ethiopia | 93.4 /100 | #110 | Exceptional 29.7% |
| Immigrants | Hungary | 93.0 /100 | #111 | Exceptional 29.7% |
| Basques | 93.0 /100 | #112 | Exceptional 29.7% |
| Scandinavians | 92.7 /100 | #113 | Exceptional 29.8% |
| Immigrants | Croatia | 92.6 /100 | #114 | Exceptional 29.8% |
Demographics Similar to Seminole by Births to Unmarried Women
In terms of births to unmarried women, the demographic groups most similar to Seminole are Blackfeet (37.9%, a difference of 0.050%), Immigrants from Nicaragua (38.0%, a difference of 0.20%), British West Indian (38.0%, a difference of 0.25%), Hispanic or Latino (37.8%, a difference of 0.34%), and Alaskan Athabascan (37.7%, a difference of 0.48%).
| Demographics | Rating | Rank | Births to Unmarried Women |
| Immigrants | Central America | 0.0 /100 | #284 | Tragic 37.4% |
| Immigrants | Mexico | 0.0 /100 | #285 | Tragic 37.5% |
| Immigrants | Guatemala | 0.0 /100 | #286 | Tragic 37.5% |
| Creek | 0.0 /100 | #287 | Tragic 37.6% |
| Immigrants | Liberia | 0.0 /100 | #288 | Tragic 37.6% |
| Alaskan Athabascans | 0.0 /100 | #289 | Tragic 37.7% |
| Hispanics or Latinos | 0.0 /100 | #290 | Tragic 37.8% |
| Seminole | 0.0 /100 | #291 | Tragic 37.9% |
| Blackfeet | 0.0 /100 | #292 | Tragic 37.9% |
| Immigrants | Nicaragua | 0.0 /100 | #293 | Tragic 38.0% |
| British West Indians | 0.0 /100 | #294 | Tragic 38.0% |
| Iroquois | 0.0 /100 | #295 | Tragic 38.2% |
| Alaska Natives | 0.0 /100 | #296 | Tragic 38.3% |
| Dutch West Indians | 0.0 /100 | #297 | Tragic 38.4% |
| Jamaicans | 0.0 /100 | #298 | Tragic 38.5% |