Immigrants from Brazil vs Macedonian Births to Unmarried Women
COMPARE
Immigrants from Brazil
Macedonian
Births to Unmarried Women
Births to Unmarried Women Comparison
Immigrants from Brazil
Macedonians
29.6%
BIRTHS TO UNMARRIED WOMEN
93.7/ 100
METRIC RATING
107th/ 347
METRIC RANK
27.9%
BIRTHS TO UNMARRIED WOMEN
99.4/ 100
METRIC RATING
51st/ 347
METRIC RANK
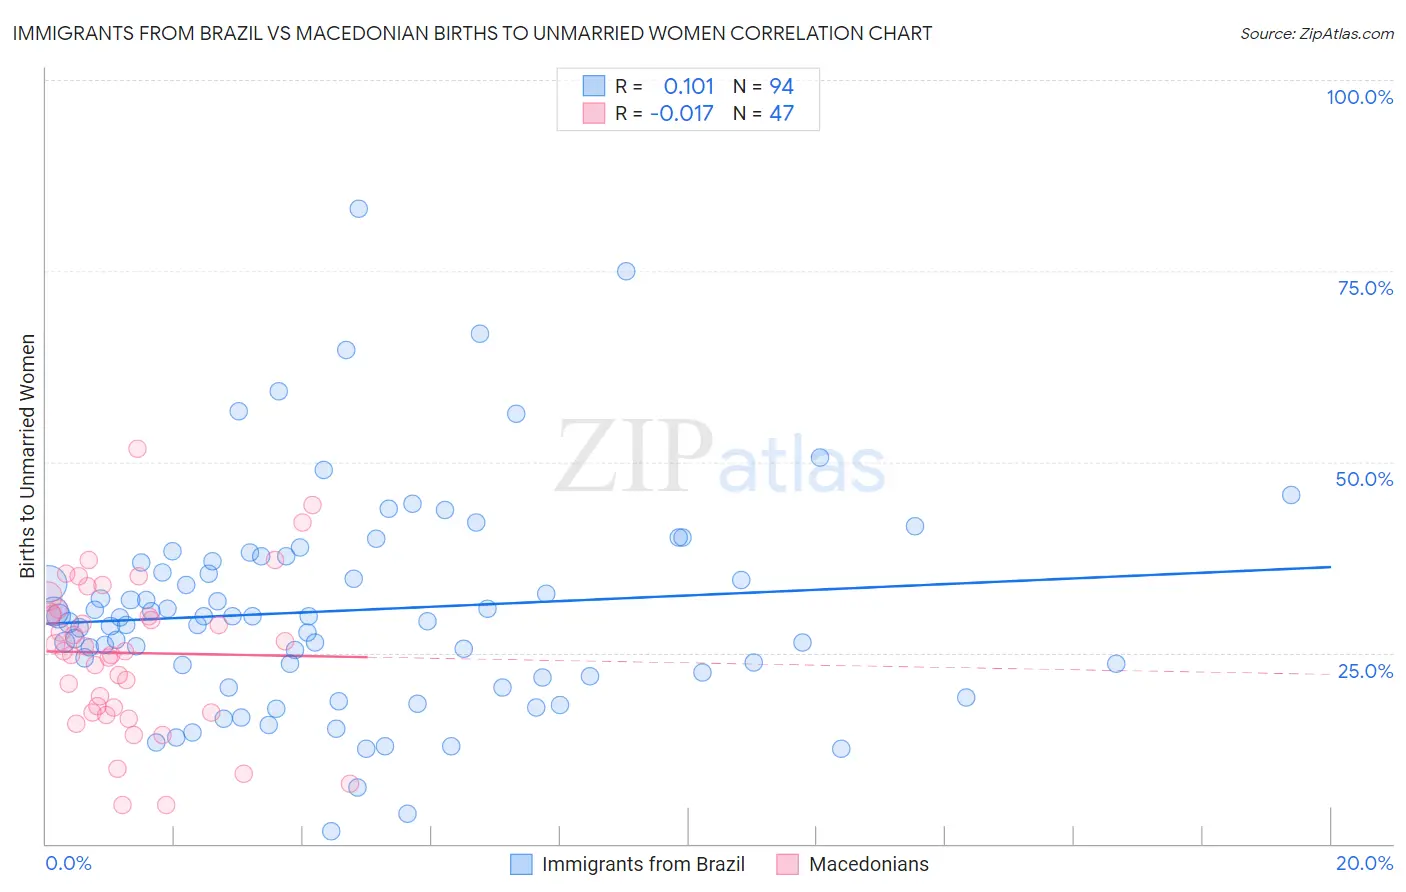
Immigrants from Brazil vs Macedonian Births to Unmarried Women Correlation Chart
The statistical analysis conducted on geographies consisting of 321,610,607 people shows a poor positive correlation between the proportion of Immigrants from Brazil and percentage of births to unmarried women in the United States with a correlation coefficient (R) of 0.101 and weighted average of 29.6%. Similarly, the statistical analysis conducted on geographies consisting of 126,355,760 people shows no correlation between the proportion of Macedonians and percentage of births to unmarried women in the United States with a correlation coefficient (R) of -0.017 and weighted average of 27.9%, a difference of 6.4%.
Births to Unmarried Women Correlation Summary
| Measurement | Immigrants from Brazil | Macedonian |
| Minimum | 1.6% | 5.0% |
| Maximum | 83.2% | 51.8% |
| Range | 81.6% | 46.8% |
| Mean | 30.6% | 25.0% |
| Median | 29.4% | 25.3% |
| Interquartile 25% (IQ1) | 22.0% | 17.2% |
| Interquartile 75% (IQ3) | 36.9% | 30.8% |
| Interquartile Range (IQR) | 14.9% | 13.5% |
| Standard Deviation (Sample) | 14.2% | 10.1% |
| Standard Deviation (Population) | 14.1% | 10.0% |
Similar Demographics by Births to Unmarried Women
Demographics Similar to Immigrants from Brazil by Births to Unmarried Women
In terms of births to unmarried women, the demographic groups most similar to Immigrants from Brazil are Swedish (29.6%, a difference of 0.010%), Paraguayan (29.7%, a difference of 0.090%), Greek (29.7%, a difference of 0.12%), Immigrants from Ethiopia (29.7%, a difference of 0.15%), and Immigrants from Nepal (29.6%, a difference of 0.27%).
| Demographics | Rating | Rank | Births to Unmarried Women |
| Luxembourgers | 95.2 /100 | #100 | Exceptional 29.4% |
| Immigrants | Northern Africa | 94.7 /100 | #101 | Exceptional 29.5% |
| Australians | 94.6 /100 | #102 | Exceptional 29.5% |
| Lebanese | 94.4 /100 | #103 | Exceptional 29.5% |
| Lithuanians | 94.4 /100 | #104 | Exceptional 29.6% |
| Immigrants | Nepal | 94.3 /100 | #105 | Exceptional 29.6% |
| Swedes | 93.8 /100 | #106 | Exceptional 29.6% |
| Immigrants | Brazil | 93.7 /100 | #107 | Exceptional 29.6% |
| Paraguayans | 93.5 /100 | #108 | Exceptional 29.7% |
| Greeks | 93.4 /100 | #109 | Exceptional 29.7% |
| Immigrants | Ethiopia | 93.4 /100 | #110 | Exceptional 29.7% |
| Immigrants | Hungary | 93.0 /100 | #111 | Exceptional 29.7% |
| Basques | 93.0 /100 | #112 | Exceptional 29.7% |
| Scandinavians | 92.7 /100 | #113 | Exceptional 29.8% |
| Immigrants | Croatia | 92.6 /100 | #114 | Exceptional 29.8% |
Demographics Similar to Macedonians by Births to Unmarried Women
In terms of births to unmarried women, the demographic groups most similar to Macedonians are Bhutanese (27.9%, a difference of 0.040%), Immigrants from Romania (27.9%, a difference of 0.050%), Afghan (27.9%, a difference of 0.12%), Maltese (27.8%, a difference of 0.13%), and Mongolian (27.9%, a difference of 0.16%).
| Demographics | Rating | Rank | Births to Unmarried Women |
| Immigrants | Indonesia | 99.5 /100 | #44 | Exceptional 27.7% |
| Latvians | 99.5 /100 | #45 | Exceptional 27.7% |
| Immigrants | Lithuania | 99.5 /100 | #46 | Exceptional 27.7% |
| Hmong | 99.5 /100 | #47 | Exceptional 27.7% |
| Eastern Europeans | 99.5 /100 | #48 | Exceptional 27.7% |
| Immigrants | Greece | 99.4 /100 | #49 | Exceptional 27.8% |
| Maltese | 99.4 /100 | #50 | Exceptional 27.8% |
| Macedonians | 99.4 /100 | #51 | Exceptional 27.9% |
| Bhutanese | 99.4 /100 | #52 | Exceptional 27.9% |
| Immigrants | Romania | 99.4 /100 | #53 | Exceptional 27.9% |
| Afghans | 99.4 /100 | #54 | Exceptional 27.9% |
| Mongolians | 99.3 /100 | #55 | Exceptional 27.9% |
| Immigrants | Belgium | 99.3 /100 | #56 | Exceptional 28.0% |
| Russians | 99.2 /100 | #57 | Exceptional 28.0% |
| Immigrants | Albania | 99.2 /100 | #58 | Exceptional 28.0% |