Immigrants from Brazil vs Immigrants from Sudan Householder Income Ages 45 - 64 years
COMPARE
Immigrants from Brazil
Immigrants from Sudan
Householder Income Ages 45 - 64 years
Householder Income Ages 45 - 64 years Comparison
Immigrants from Brazil
Immigrants from Sudan
$106,470
HOUSEHOLDER INCOME AGES 45 - 64 YEARS
95.6/ 100
METRIC RATING
110th/ 347
METRIC RANK
$93,781
HOUSEHOLDER INCOME AGES 45 - 64 YEARS
3.6/ 100
METRIC RATING
230th/ 347
METRIC RANK
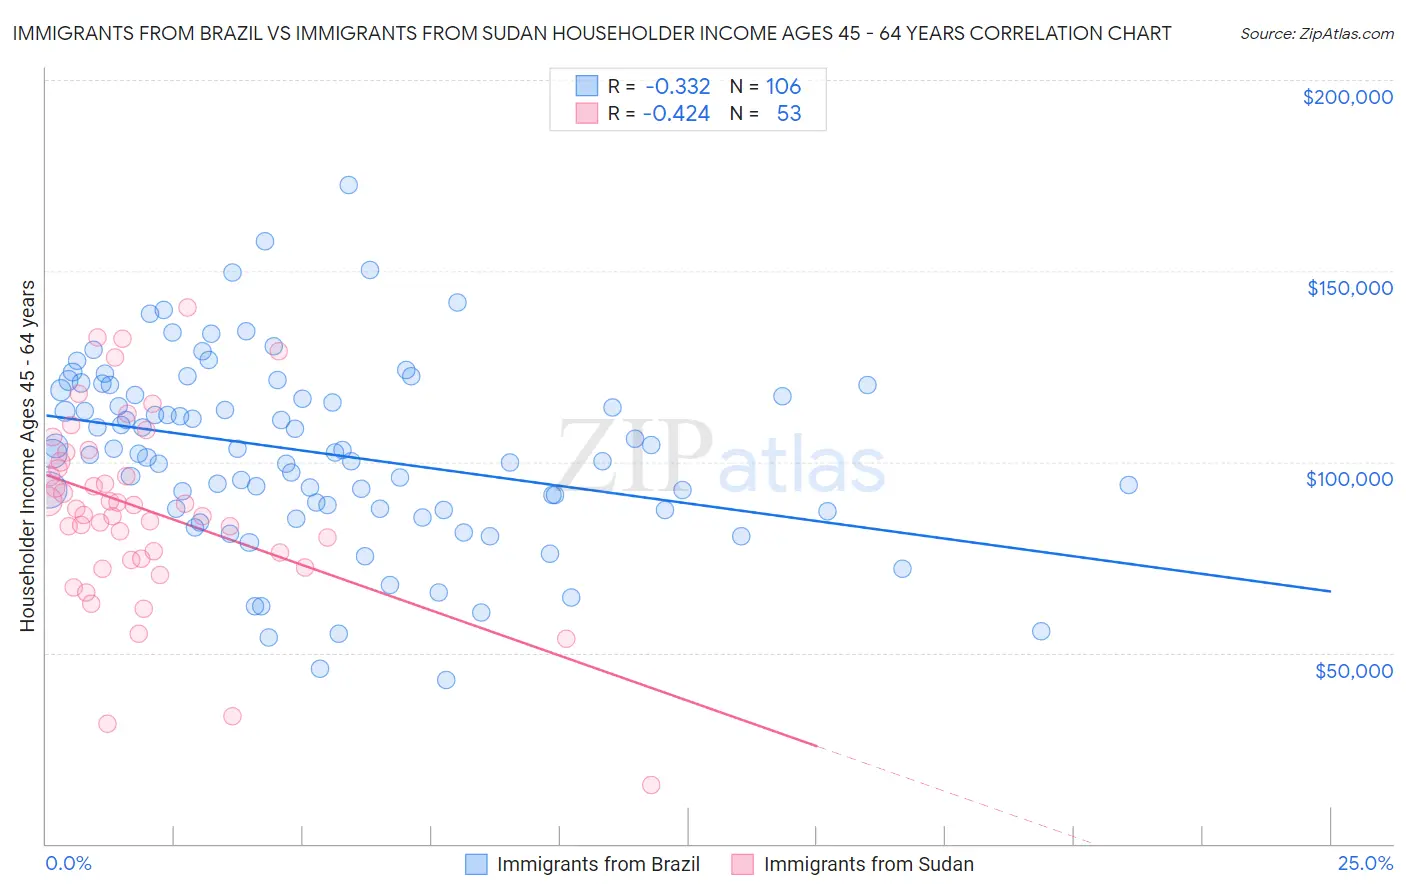
Immigrants from Brazil vs Immigrants from Sudan Householder Income Ages 45 - 64 years Correlation Chart
The statistical analysis conducted on geographies consisting of 342,574,187 people shows a mild negative correlation between the proportion of Immigrants from Brazil and household income with householder between the ages 45 and 64 in the United States with a correlation coefficient (R) of -0.332 and weighted average of $106,470. Similarly, the statistical analysis conducted on geographies consisting of 118,891,681 people shows a moderate negative correlation between the proportion of Immigrants from Sudan and household income with householder between the ages 45 and 64 in the United States with a correlation coefficient (R) of -0.424 and weighted average of $93,781, a difference of 13.5%.
Householder Income Ages 45 - 64 years Correlation Summary
| Measurement | Immigrants from Brazil | Immigrants from Sudan |
| Minimum | $42,860 | $15,339 |
| Maximum | $172,341 | $140,439 |
| Range | $129,481 | $125,100 |
| Mean | $102,398 | $87,470 |
| Median | $102,298 | $87,864 |
| Interquartile 25% (IQ1) | $87,781 | $74,422 |
| Interquartile 75% (IQ3) | $118,810 | $101,249 |
| Interquartile Range (IQR) | $31,029 | $26,828 |
| Standard Deviation (Sample) | $24,082 | $24,768 |
| Standard Deviation (Population) | $23,969 | $24,533 |
Similar Demographics by Householder Income Ages 45 - 64 years
Demographics Similar to Immigrants from Brazil by Householder Income Ages 45 - 64 years
In terms of householder income ages 45 - 64 years, the demographic groups most similar to Immigrants from Brazil are Immigrants from Vietnam ($106,417, a difference of 0.050%), Swedish ($106,377, a difference of 0.090%), European ($106,367, a difference of 0.10%), Chilean ($106,611, a difference of 0.13%), and Immigrants from Poland ($106,319, a difference of 0.14%).
| Demographics | Rating | Rank | Householder Income Ages 45 - 64 years |
| Syrians | 96.9 /100 | #103 | Exceptional $107,207 |
| Immigrants | Ukraine | 96.7 /100 | #104 | Exceptional $107,079 |
| Macedonians | 96.7 /100 | #105 | Exceptional $107,074 |
| Armenians | 96.6 /100 | #106 | Exceptional $107,002 |
| Immigrants | Fiji | 96.5 /100 | #107 | Exceptional $106,952 |
| Zimbabweans | 96.3 /100 | #108 | Exceptional $106,849 |
| Chileans | 95.9 /100 | #109 | Exceptional $106,611 |
| Immigrants | Brazil | 95.6 /100 | #110 | Exceptional $106,470 |
| Immigrants | Vietnam | 95.5 /100 | #111 | Exceptional $106,417 |
| Swedes | 95.4 /100 | #112 | Exceptional $106,377 |
| Europeans | 95.4 /100 | #113 | Exceptional $106,367 |
| Immigrants | Poland | 95.3 /100 | #114 | Exceptional $106,319 |
| Immigrants | Kuwait | 95.2 /100 | #115 | Exceptional $106,285 |
| British | 95.2 /100 | #116 | Exceptional $106,264 |
| Albanians | 95.1 /100 | #117 | Exceptional $106,243 |
Demographics Similar to Immigrants from Sudan by Householder Income Ages 45 - 64 years
In terms of householder income ages 45 - 64 years, the demographic groups most similar to Immigrants from Sudan are Vietnamese ($93,788, a difference of 0.010%), Immigrants from Panama ($93,815, a difference of 0.040%), Ecuadorian ($93,739, a difference of 0.040%), Sudanese ($93,718, a difference of 0.070%), and Alaska Native ($93,991, a difference of 0.22%).
| Demographics | Rating | Rank | Householder Income Ages 45 - 64 years |
| Immigrants | Nonimmigrants | 5.0 /100 | #223 | Tragic $94,448 |
| Immigrants | Bosnia and Herzegovina | 4.6 /100 | #224 | Tragic $94,288 |
| Bermudans | 4.4 /100 | #225 | Tragic $94,197 |
| Immigrants | Azores | 4.3 /100 | #226 | Tragic $94,138 |
| Alaska Natives | 4.0 /100 | #227 | Tragic $93,991 |
| Immigrants | Panama | 3.7 /100 | #228 | Tragic $93,815 |
| Vietnamese | 3.6 /100 | #229 | Tragic $93,788 |
| Immigrants | Sudan | 3.6 /100 | #230 | Tragic $93,781 |
| Ecuadorians | 3.6 /100 | #231 | Tragic $93,739 |
| Sudanese | 3.5 /100 | #232 | Tragic $93,718 |
| Nepalese | 3.0 /100 | #233 | Tragic $93,355 |
| Immigrants | El Salvador | 2.7 /100 | #234 | Tragic $93,176 |
| Nicaraguans | 2.0 /100 | #235 | Tragic $92,554 |
| Immigrants | Western Africa | 1.8 /100 | #236 | Tragic $92,384 |
| Immigrants | Bangladesh | 1.7 /100 | #237 | Tragic $92,208 |