Houma vs Scotch-Irish Births to Unmarried Women
COMPARE
Houma
Scotch-Irish
Births to Unmarried Women
Births to Unmarried Women Comparison
Houma
Scotch-Irish
46.6%
BIRTHS TO UNMARRIED WOMEN
0.0/ 100
METRIC RATING
337th/ 347
METRIC RANK
33.3%
BIRTHS TO UNMARRIED WOMEN
10.7/ 100
METRIC RATING
210th/ 347
METRIC RANK
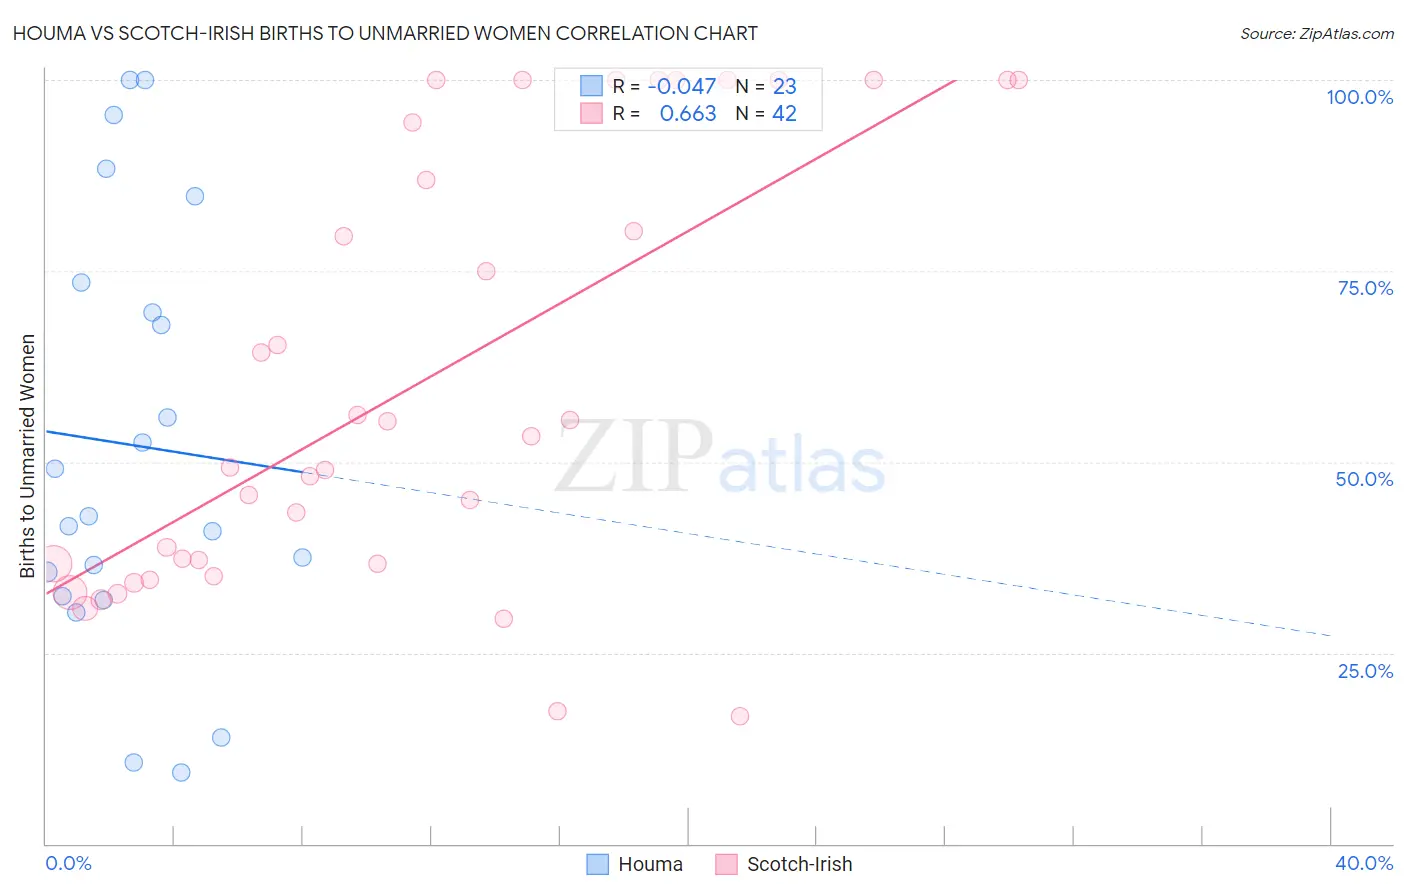
Houma vs Scotch-Irish Births to Unmarried Women Correlation Chart
The statistical analysis conducted on geographies consisting of 36,513,880 people shows no correlation between the proportion of Houma and percentage of births to unmarried women in the United States with a correlation coefficient (R) of -0.047 and weighted average of 46.6%. Similarly, the statistical analysis conducted on geographies consisting of 488,755,262 people shows a significant positive correlation between the proportion of Scotch-Irish and percentage of births to unmarried women in the United States with a correlation coefficient (R) of 0.663 and weighted average of 33.3%, a difference of 40.0%.
Births to Unmarried Women Correlation Summary
| Measurement | Houma | Scotch-Irish |
| Minimum | 9.3% | 16.7% |
| Maximum | 100.0% | 100.0% |
| Range | 90.7% | 83.3% |
| Mean | 52.2% | 60.2% |
| Median | 42.9% | 51.3% |
| Interquartile 25% (IQ1) | 32.4% | 36.6% |
| Interquartile 75% (IQ3) | 73.4% | 94.4% |
| Interquartile Range (IQR) | 41.0% | 57.8% |
| Standard Deviation (Sample) | 28.0% | 28.1% |
| Standard Deviation (Population) | 27.3% | 27.8% |
Similar Demographics by Births to Unmarried Women
Demographics Similar to Houma by Births to Unmarried Women
In terms of births to unmarried women, the demographic groups most similar to Houma are Arapaho (47.1%, a difference of 1.2%), Puerto Rican (45.7%, a difference of 1.9%), Colville (45.3%, a difference of 2.7%), Lumbee (48.2%, a difference of 3.5%), and Yuman (44.4%, a difference of 4.9%).
| Demographics | Rating | Rank | Births to Unmarried Women |
| Chippewa | 0.0 /100 | #330 | Tragic 42.6% |
| Natives/Alaskans | 0.0 /100 | #331 | Tragic 43.0% |
| Kiowa | 0.0 /100 | #332 | Tragic 43.1% |
| Blacks/African Americans | 0.0 /100 | #333 | Tragic 44.3% |
| Yuman | 0.0 /100 | #334 | Tragic 44.4% |
| Colville | 0.0 /100 | #335 | Tragic 45.3% |
| Puerto Ricans | 0.0 /100 | #336 | Tragic 45.7% |
| Houma | 0.0 /100 | #337 | Tragic 46.6% |
| Arapaho | 0.0 /100 | #338 | Tragic 47.1% |
| Lumbee | 0.0 /100 | #339 | Tragic 48.2% |
| Tohono O'odham | 0.0 /100 | #340 | Tragic 49.8% |
| Hopi | 0.0 /100 | #341 | Tragic 50.8% |
| Menominee | 0.0 /100 | #342 | Tragic 51.1% |
| Pima | 0.0 /100 | #343 | Tragic 51.5% |
| Navajo | 0.0 /100 | #344 | Tragic 51.5% |
Demographics Similar to Scotch-Irish by Births to Unmarried Women
In terms of births to unmarried women, the demographic groups most similar to Scotch-Irish are White/Caucasian (33.3%, a difference of 0.0%), Ecuadorian (33.3%, a difference of 0.050%), Celtic (33.3%, a difference of 0.12%), Hawaiian (33.2%, a difference of 0.14%), and Immigrants from Sudan (33.2%, a difference of 0.17%).
| Demographics | Rating | Rank | Births to Unmarried Women |
| Ute | 14.4 /100 | #203 | Poor 33.0% |
| Immigrants | Africa | 14.3 /100 | #204 | Poor 33.0% |
| German Russians | 13.1 /100 | #205 | Poor 33.1% |
| Uruguayans | 12.8 /100 | #206 | Poor 33.1% |
| Immigrants | Sudan | 11.5 /100 | #207 | Poor 33.2% |
| Hawaiians | 11.3 /100 | #208 | Poor 33.2% |
| Whites/Caucasians | 10.7 /100 | #209 | Poor 33.3% |
| Scotch-Irish | 10.7 /100 | #210 | Poor 33.3% |
| Ecuadorians | 10.5 /100 | #211 | Poor 33.3% |
| Celtics | 10.2 /100 | #212 | Poor 33.3% |
| Immigrants | Costa Rica | 9.5 /100 | #213 | Tragic 33.4% |
| Slovaks | 9.3 /100 | #214 | Tragic 33.4% |
| French | 8.7 /100 | #215 | Tragic 33.4% |
| Nepalese | 7.8 /100 | #216 | Tragic 33.5% |
| Spaniards | 7.0 /100 | #217 | Tragic 33.6% |