Houma vs Scotch-Irish Married-couple Households
COMPARE
Houma
Scotch-Irish
Married-couple Households
Married-couple Households Comparison
Houma
Scotch-Irish
44.6%
MARRIED-COUPLE HOUSEHOLDS
1.5/ 100
METRIC RATING
231st/ 347
METRIC RANK
48.3%
MARRIED-COUPLE HOUSEHOLDS
98.6/ 100
METRIC RATING
72nd/ 347
METRIC RANK
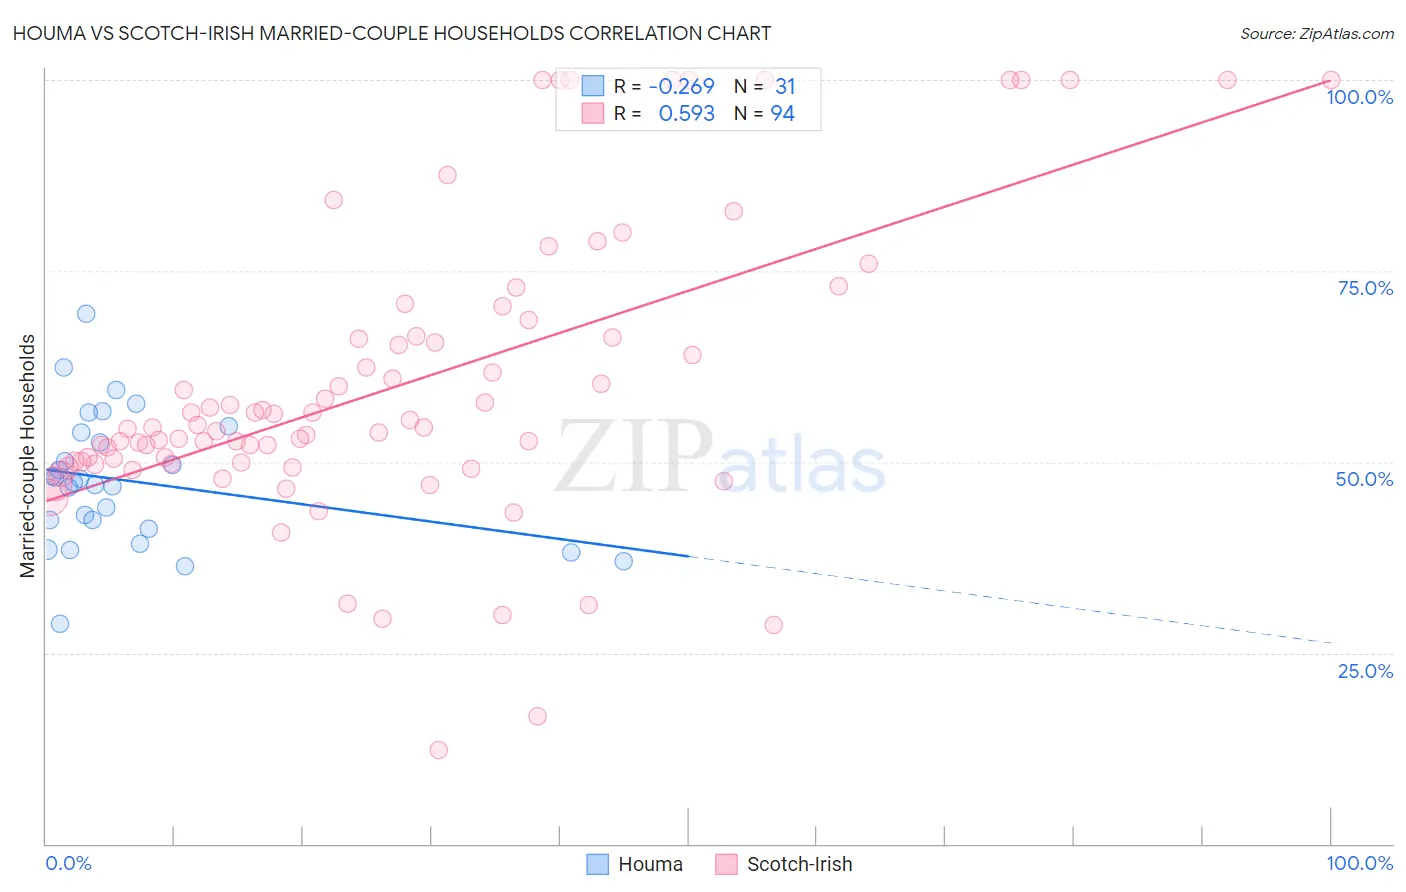
Houma vs Scotch-Irish Married-couple Households Correlation Chart
The statistical analysis conducted on geographies consisting of 36,791,862 people shows a weak negative correlation between the proportion of Houma and percentage of married-couple family households in the United States with a correlation coefficient (R) of -0.269 and weighted average of 44.6%. Similarly, the statistical analysis conducted on geographies consisting of 548,347,106 people shows a substantial positive correlation between the proportion of Scotch-Irish and percentage of married-couple family households in the United States with a correlation coefficient (R) of 0.593 and weighted average of 48.3%, a difference of 8.2%.
Married-couple Households Correlation Summary
| Measurement | Houma | Scotch-Irish |
| Minimum | 28.8% | 12.2% |
| Maximum | 69.3% | 100.0% |
| Range | 40.6% | 87.8% |
| Mean | 47.5% | 60.1% |
| Median | 47.3% | 54.5% |
| Interquartile 25% (IQ1) | 41.3% | 49.9% |
| Interquartile 75% (IQ3) | 53.8% | 66.4% |
| Interquartile Range (IQR) | 12.5% | 16.6% |
| Standard Deviation (Sample) | 8.7% | 19.3% |
| Standard Deviation (Population) | 8.5% | 19.2% |
Similar Demographics by Married-couple Households
Demographics Similar to Houma by Married-couple Households
In terms of married-couple households, the demographic groups most similar to Houma are Marshallese (44.6%, a difference of 0.0%), Soviet Union (44.6%, a difference of 0.010%), Immigrants from Uganda (44.6%, a difference of 0.040%), Immigrants from Latin America (44.7%, a difference of 0.050%), and Kenyan (44.7%, a difference of 0.10%).
| Demographics | Rating | Rank | Married-couple Households |
| Immigrants | Micronesia | 2.6 /100 | #224 | Tragic 44.9% |
| Dutch West Indians | 2.6 /100 | #225 | Tragic 44.9% |
| Alsatians | 2.3 /100 | #226 | Tragic 44.8% |
| Salvadorans | 1.9 /100 | #227 | Tragic 44.7% |
| Kenyans | 1.7 /100 | #228 | Tragic 44.7% |
| Immigrants | Latin America | 1.6 /100 | #229 | Tragic 44.7% |
| Soviet Union | 1.6 /100 | #230 | Tragic 44.6% |
| Houma | 1.5 /100 | #231 | Tragic 44.6% |
| Marshallese | 1.5 /100 | #232 | Tragic 44.6% |
| Immigrants | Uganda | 1.5 /100 | #233 | Tragic 44.6% |
| Immigrants | Panama | 1.3 /100 | #234 | Tragic 44.6% |
| Immigrants | Nicaragua | 1.2 /100 | #235 | Tragic 44.5% |
| Yaqui | 1.2 /100 | #236 | Tragic 44.5% |
| Comanche | 1.2 /100 | #237 | Tragic 44.5% |
| Immigrants | Uruguay | 1.1 /100 | #238 | Tragic 44.5% |
Demographics Similar to Scotch-Irish by Married-couple Households
In terms of married-couple households, the demographic groups most similar to Scotch-Irish are Immigrants from Singapore (48.3%, a difference of 0.020%), Immigrants from Romania (48.3%, a difference of 0.040%), Immigrants from England (48.2%, a difference of 0.12%), Immigrants from Fiji (48.2%, a difference of 0.13%), and Laotian (48.4%, a difference of 0.17%).
| Demographics | Rating | Rank | Married-couple Households |
| Immigrants | Canada | 99.0 /100 | #65 | Exceptional 48.4% |
| Jordanians | 98.9 /100 | #66 | Exceptional 48.4% |
| Romanians | 98.9 /100 | #67 | Exceptional 48.4% |
| Immigrants | South Eastern Asia | 98.9 /100 | #68 | Exceptional 48.4% |
| Immigrants | China | 98.9 /100 | #69 | Exceptional 48.4% |
| Immigrants | North America | 98.9 /100 | #70 | Exceptional 48.4% |
| Laotians | 98.8 /100 | #71 | Exceptional 48.4% |
| Scotch-Irish | 98.6 /100 | #72 | Exceptional 48.3% |
| Immigrants | Singapore | 98.6 /100 | #73 | Exceptional 48.3% |
| Immigrants | Romania | 98.6 /100 | #74 | Exceptional 48.3% |
| Immigrants | England | 98.4 /100 | #75 | Exceptional 48.2% |
| Immigrants | Fiji | 98.4 /100 | #76 | Exceptional 48.2% |
| Canadians | 98.2 /100 | #77 | Exceptional 48.2% |
| Egyptians | 98.2 /100 | #78 | Exceptional 48.2% |
| Immigrants | Netherlands | 98.2 /100 | #79 | Exceptional 48.2% |