Houma vs Immigrants from Scotland Births to Unmarried Women
COMPARE
Houma
Immigrants from Scotland
Births to Unmarried Women
Births to Unmarried Women Comparison
Houma
Immigrants from Scotland
46.6%
BIRTHS TO UNMARRIED WOMEN
0.0/ 100
METRIC RATING
337th/ 347
METRIC RANK
30.4%
BIRTHS TO UNMARRIED WOMEN
84.6/ 100
METRIC RATING
136th/ 347
METRIC RANK
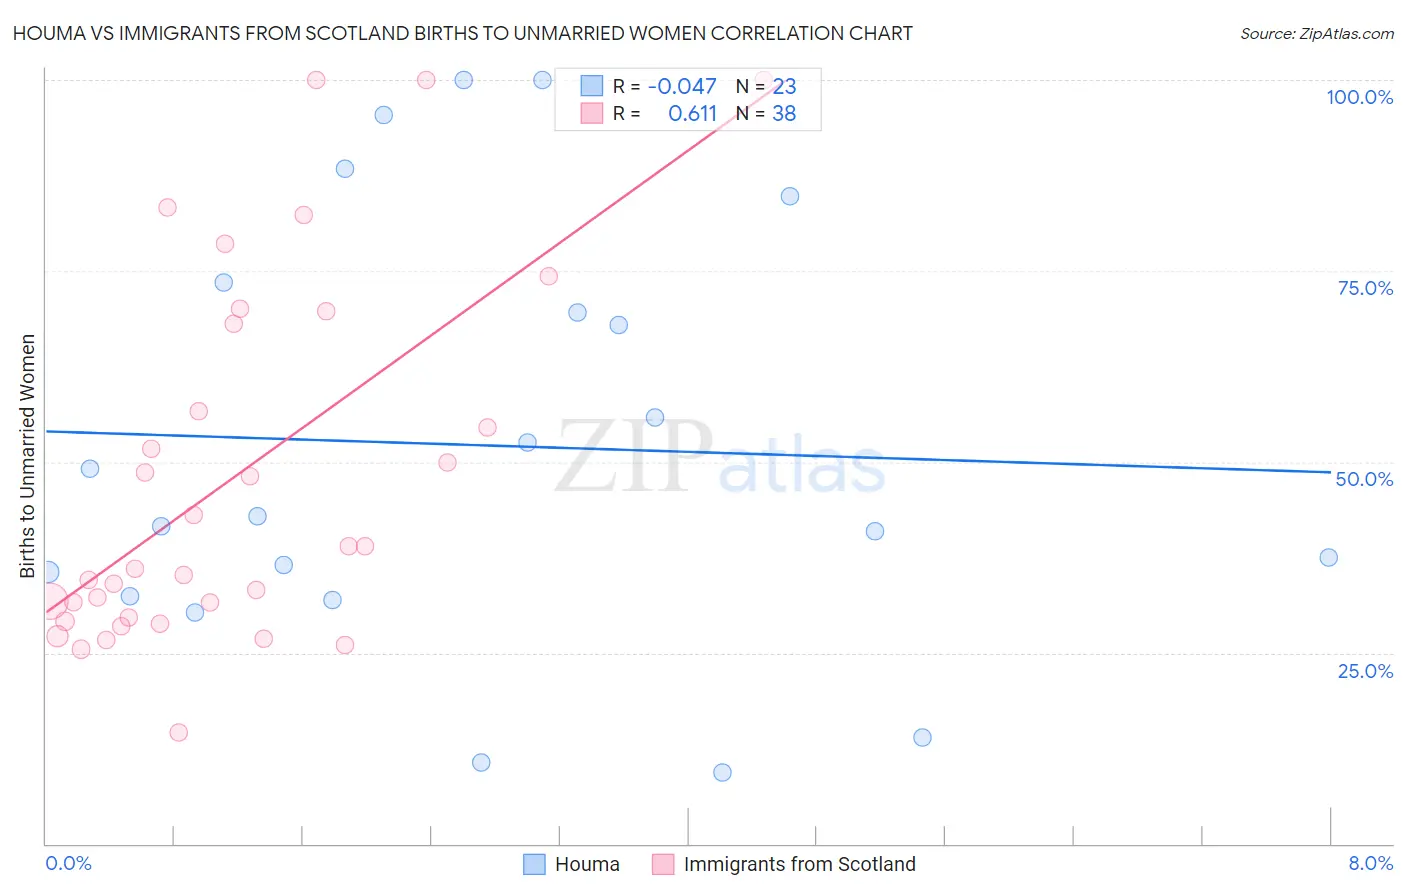
Houma vs Immigrants from Scotland Births to Unmarried Women Correlation Chart
The statistical analysis conducted on geographies consisting of 36,513,880 people shows no correlation between the proportion of Houma and percentage of births to unmarried women in the United States with a correlation coefficient (R) of -0.047 and weighted average of 46.6%. Similarly, the statistical analysis conducted on geographies consisting of 185,682,115 people shows a significant positive correlation between the proportion of Immigrants from Scotland and percentage of births to unmarried women in the United States with a correlation coefficient (R) of 0.611 and weighted average of 30.4%, a difference of 53.2%.
Births to Unmarried Women Correlation Summary
| Measurement | Houma | Immigrants from Scotland |
| Minimum | 9.3% | 14.6% |
| Maximum | 100.0% | 100.0% |
| Range | 90.7% | 85.4% |
| Mean | 52.2% | 47.9% |
| Median | 42.9% | 37.5% |
| Interquartile 25% (IQ1) | 32.4% | 29.6% |
| Interquartile 75% (IQ3) | 73.4% | 68.2% |
| Interquartile Range (IQR) | 41.0% | 38.6% |
| Standard Deviation (Sample) | 28.0% | 23.6% |
| Standard Deviation (Population) | 27.3% | 23.3% |
Similar Demographics by Births to Unmarried Women
Demographics Similar to Houma by Births to Unmarried Women
In terms of births to unmarried women, the demographic groups most similar to Houma are Arapaho (47.1%, a difference of 1.2%), Puerto Rican (45.7%, a difference of 1.9%), Colville (45.3%, a difference of 2.7%), Lumbee (48.2%, a difference of 3.5%), and Yuman (44.4%, a difference of 4.9%).
| Demographics | Rating | Rank | Births to Unmarried Women |
| Chippewa | 0.0 /100 | #330 | Tragic 42.6% |
| Natives/Alaskans | 0.0 /100 | #331 | Tragic 43.0% |
| Kiowa | 0.0 /100 | #332 | Tragic 43.1% |
| Blacks/African Americans | 0.0 /100 | #333 | Tragic 44.3% |
| Yuman | 0.0 /100 | #334 | Tragic 44.4% |
| Colville | 0.0 /100 | #335 | Tragic 45.3% |
| Puerto Ricans | 0.0 /100 | #336 | Tragic 45.7% |
| Houma | 0.0 /100 | #337 | Tragic 46.6% |
| Arapaho | 0.0 /100 | #338 | Tragic 47.1% |
| Lumbee | 0.0 /100 | #339 | Tragic 48.2% |
| Tohono O'odham | 0.0 /100 | #340 | Tragic 49.8% |
| Hopi | 0.0 /100 | #341 | Tragic 50.8% |
| Menominee | 0.0 /100 | #342 | Tragic 51.1% |
| Pima | 0.0 /100 | #343 | Tragic 51.5% |
| Navajo | 0.0 /100 | #344 | Tragic 51.5% |
Demographics Similar to Immigrants from Scotland by Births to Unmarried Women
In terms of births to unmarried women, the demographic groups most similar to Immigrants from Scotland are Brazilian (30.4%, a difference of 0.030%), Immigrants from South Eastern Asia (30.4%, a difference of 0.11%), Immigrants from Morocco (30.4%, a difference of 0.12%), Immigrants from Philippines (30.4%, a difference of 0.13%), and Puget Sound Salish (30.4%, a difference of 0.13%).
| Demographics | Rating | Rank | Births to Unmarried Women |
| Immigrants | Spain | 85.8 /100 | #129 | Excellent 30.3% |
| Immigrants | Bosnia and Herzegovina | 85.7 /100 | #130 | Excellent 30.3% |
| Immigrants | Zimbabwe | 85.7 /100 | #131 | Excellent 30.3% |
| New Zealanders | 85.5 /100 | #132 | Excellent 30.3% |
| Immigrants | Morocco | 85.2 /100 | #133 | Excellent 30.4% |
| Immigrants | South Eastern Asia | 85.2 /100 | #134 | Excellent 30.4% |
| Brazilians | 84.8 /100 | #135 | Excellent 30.4% |
| Immigrants | Scotland | 84.6 /100 | #136 | Excellent 30.4% |
| Immigrants | Philippines | 83.9 /100 | #137 | Excellent 30.4% |
| Puget Sound Salish | 83.9 /100 | #138 | Excellent 30.4% |
| Immigrants | Canada | 83.7 /100 | #139 | Excellent 30.4% |
| Swiss | 83.1 /100 | #140 | Excellent 30.5% |
| Pakistanis | 83.0 /100 | #141 | Excellent 30.5% |
| South Africans | 82.7 /100 | #142 | Excellent 30.5% |
| Immigrants | Uganda | 82.6 /100 | #143 | Excellent 30.5% |