Houma vs Scotch-Irish 10th Grade
COMPARE
Houma
Scotch-Irish
10th Grade
10th Grade Comparison
Houma
Scotch-Irish
90.2%
10TH GRADE
0.0/ 100
METRIC RATING
320th/ 347
METRIC RANK
95.2%
10TH GRADE
99.9/ 100
METRIC RATING
40th/ 347
METRIC RANK
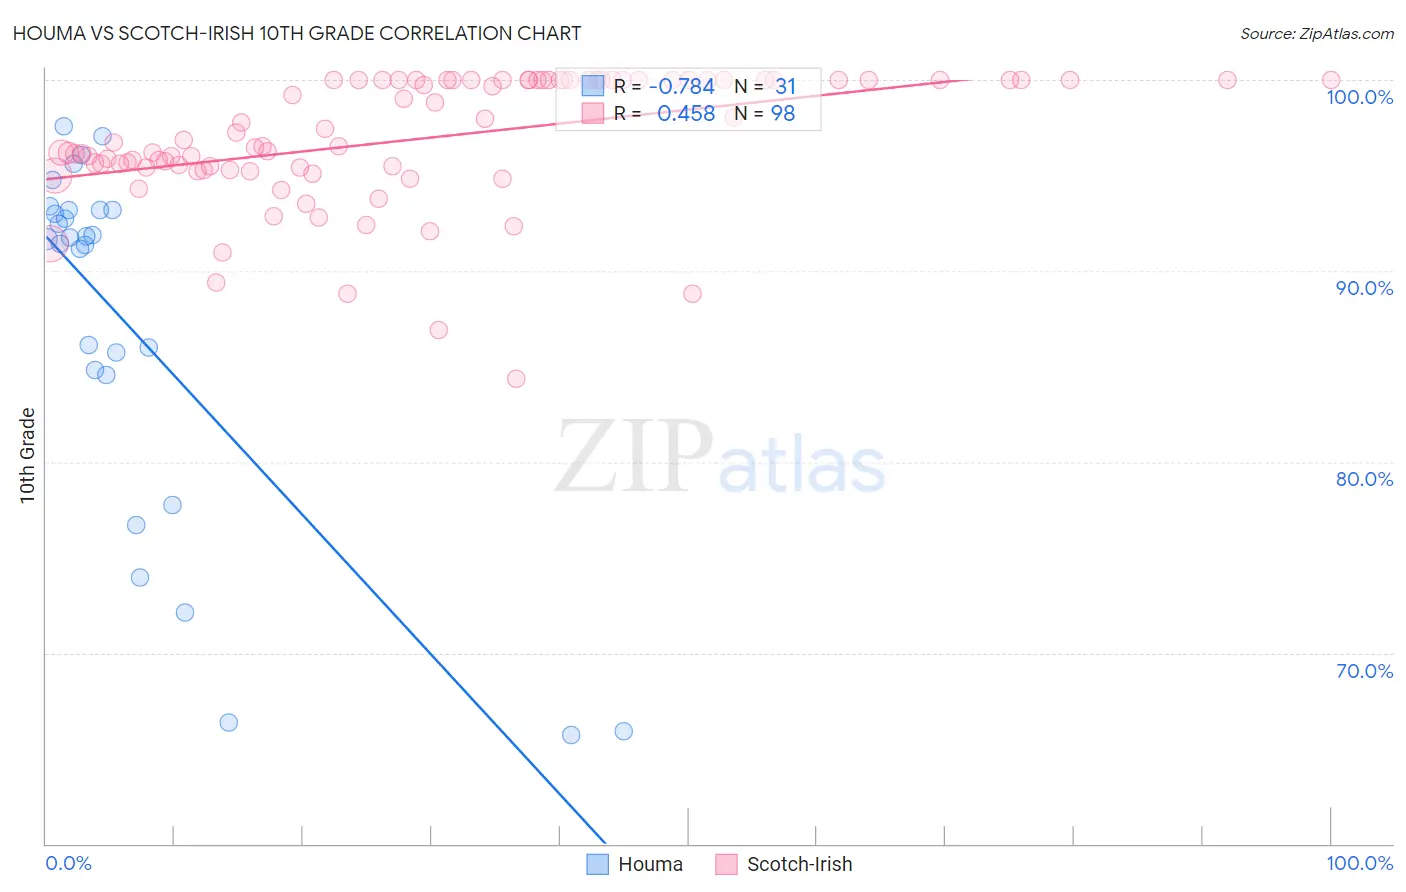
Houma vs Scotch-Irish 10th Grade Correlation Chart
The statistical analysis conducted on geographies consisting of 36,795,916 people shows a strong negative correlation between the proportion of Houma and percentage of population with at least 10th grade education in the United States with a correlation coefficient (R) of -0.784 and weighted average of 90.2%. Similarly, the statistical analysis conducted on geographies consisting of 548,777,546 people shows a moderate positive correlation between the proportion of Scotch-Irish and percentage of population with at least 10th grade education in the United States with a correlation coefficient (R) of 0.458 and weighted average of 95.2%, a difference of 5.6%.
10th Grade Correlation Summary
| Measurement | Houma | Scotch-Irish |
| Minimum | 65.7% | 84.4% |
| Maximum | 97.6% | 100.0% |
| Range | 31.9% | 15.6% |
| Mean | 87.1% | 96.9% |
| Median | 91.7% | 96.7% |
| Interquartile 25% (IQ1) | 84.5% | 95.4% |
| Interquartile 75% (IQ3) | 93.2% | 100.0% |
| Interquartile Range (IQR) | 8.6% | 4.6% |
| Standard Deviation (Sample) | 9.6% | 3.3% |
| Standard Deviation (Population) | 9.4% | 3.3% |
Similar Demographics by 10th Grade
Demographics Similar to Houma by 10th Grade
In terms of 10th grade, the demographic groups most similar to Houma are Belizean (90.2%, a difference of 0.0%), Nicaraguan (90.2%, a difference of 0.010%), Tohono O'odham (90.1%, a difference of 0.010%), Immigrants from Cuba (90.2%, a difference of 0.090%), and Immigrants from Belize (90.1%, a difference of 0.11%).
| Demographics | Rating | Rank | 10th Grade |
| Cape Verdeans | 0.0 /100 | #313 | Tragic 90.8% |
| Nepalese | 0.0 /100 | #314 | Tragic 90.7% |
| Immigrants | Caribbean | 0.0 /100 | #315 | Tragic 90.6% |
| Ecuadorians | 0.0 /100 | #316 | Tragic 90.6% |
| Immigrants | Ecuador | 0.0 /100 | #317 | Tragic 90.4% |
| Immigrants | Cuba | 0.0 /100 | #318 | Tragic 90.2% |
| Nicaraguans | 0.0 /100 | #319 | Tragic 90.2% |
| Houma | 0.0 /100 | #320 | Tragic 90.2% |
| Belizeans | 0.0 /100 | #321 | Tragic 90.2% |
| Tohono O'odham | 0.0 /100 | #322 | Tragic 90.1% |
| Immigrants | Belize | 0.0 /100 | #323 | Tragic 90.1% |
| Immigrants | Armenia | 0.0 /100 | #324 | Tragic 89.9% |
| Puerto Ricans | 0.0 /100 | #325 | Tragic 89.8% |
| Central American Indians | 0.0 /100 | #326 | Tragic 89.7% |
| Immigrants | Nicaragua | 0.0 /100 | #327 | Tragic 89.5% |
Demographics Similar to Scotch-Irish by 10th Grade
In terms of 10th grade, the demographic groups most similar to Scotch-Irish are Immigrants from Scotland (95.2%, a difference of 0.0%), Russian (95.2%, a difference of 0.020%), Northern European (95.3%, a difference of 0.030%), French Canadian (95.3%, a difference of 0.060%), and Slavic (95.2%, a difference of 0.060%).
| Demographics | Rating | Rank | 10th Grade |
| French | 100.0 /100 | #33 | Exceptional 95.3% |
| British | 99.9 /100 | #34 | Exceptional 95.3% |
| Estonians | 99.9 /100 | #35 | Exceptional 95.3% |
| Immigrants | India | 99.9 /100 | #36 | Exceptional 95.3% |
| French Canadians | 99.9 /100 | #37 | Exceptional 95.3% |
| Northern Europeans | 99.9 /100 | #38 | Exceptional 95.3% |
| Immigrants | Scotland | 99.9 /100 | #39 | Exceptional 95.2% |
| Scotch-Irish | 99.9 /100 | #40 | Exceptional 95.2% |
| Russians | 99.9 /100 | #41 | Exceptional 95.2% |
| Slavs | 99.9 /100 | #42 | Exceptional 95.2% |
| Macedonians | 99.9 /100 | #43 | Exceptional 95.2% |
| Immigrants | Northern Europe | 99.9 /100 | #44 | Exceptional 95.2% |
| Greeks | 99.9 /100 | #45 | Exceptional 95.2% |
| Czechoslovakians | 99.9 /100 | #46 | Exceptional 95.1% |
| Serbians | 99.9 /100 | #47 | Exceptional 95.1% |