Immigrants from South Central Asia vs Scotch-Irish Births to Unmarried Women
COMPARE
Immigrants from South Central Asia
Scotch-Irish
Births to Unmarried Women
Births to Unmarried Women Comparison
Immigrants from South Central Asia
Scotch-Irish
24.7%
BIRTHS TO UNMARRIED WOMEN
100.0/ 100
METRIC RATING
9th/ 347
METRIC RANK
33.3%
BIRTHS TO UNMARRIED WOMEN
10.7/ 100
METRIC RATING
210th/ 347
METRIC RANK
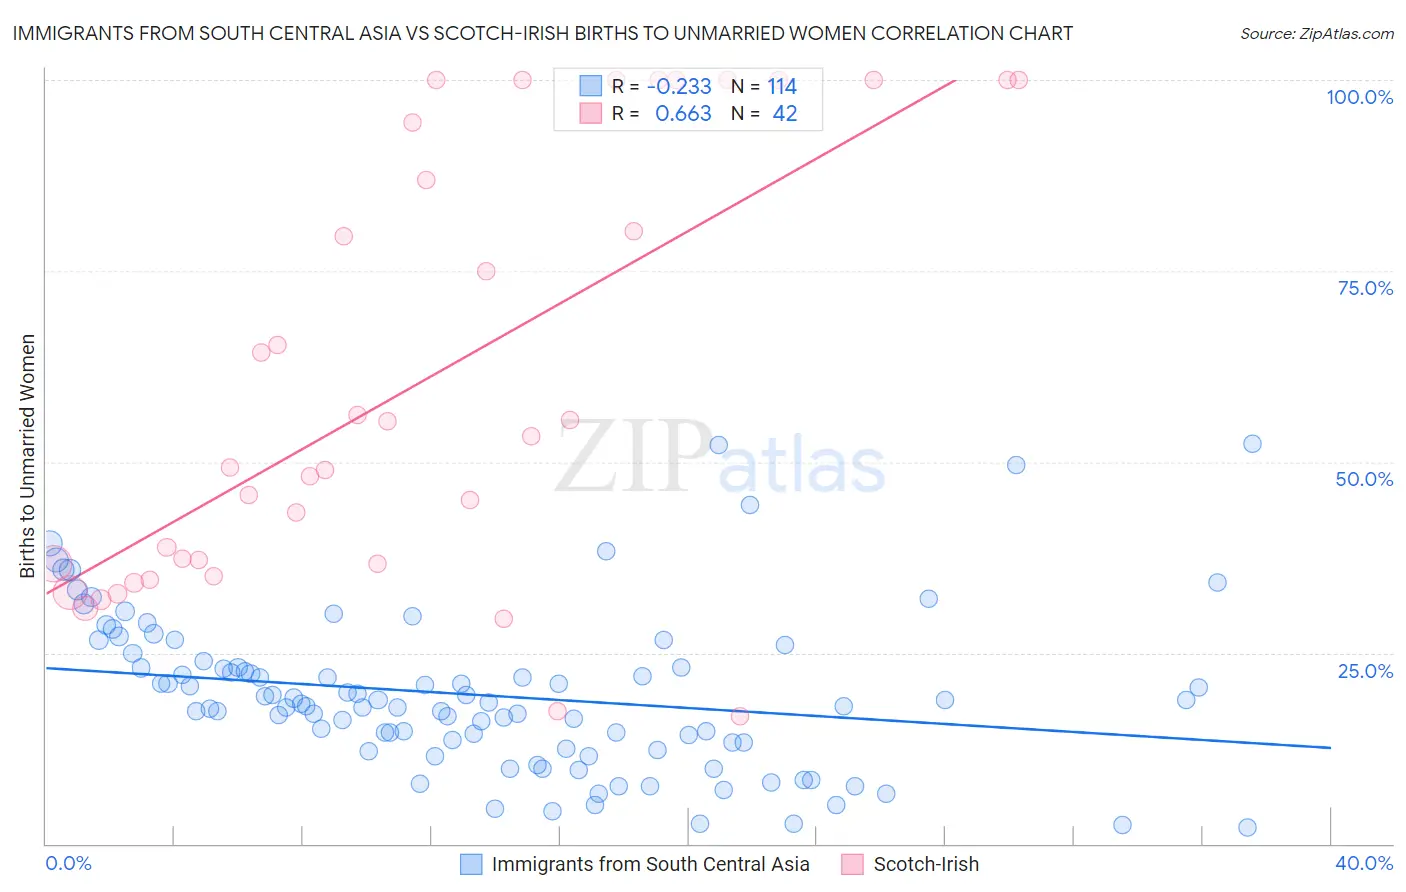
Immigrants from South Central Asia vs Scotch-Irish Births to Unmarried Women Correlation Chart
The statistical analysis conducted on geographies consisting of 435,679,472 people shows a weak negative correlation between the proportion of Immigrants from South Central Asia and percentage of births to unmarried women in the United States with a correlation coefficient (R) of -0.233 and weighted average of 24.7%. Similarly, the statistical analysis conducted on geographies consisting of 488,755,262 people shows a significant positive correlation between the proportion of Scotch-Irish and percentage of births to unmarried women in the United States with a correlation coefficient (R) of 0.663 and weighted average of 33.3%, a difference of 34.7%.
Births to Unmarried Women Correlation Summary
| Measurement | Immigrants from South Central Asia | Scotch-Irish |
| Minimum | 2.1% | 16.7% |
| Maximum | 52.4% | 100.0% |
| Range | 50.3% | 83.3% |
| Mean | 19.5% | 60.2% |
| Median | 18.4% | 51.3% |
| Interquartile 25% (IQ1) | 13.2% | 36.6% |
| Interquartile 75% (IQ3) | 23.1% | 94.4% |
| Interquartile Range (IQR) | 9.9% | 57.8% |
| Standard Deviation (Sample) | 10.2% | 28.1% |
| Standard Deviation (Population) | 10.2% | 27.8% |
Similar Demographics by Births to Unmarried Women
Demographics Similar to Immigrants from South Central Asia by Births to Unmarried Women
In terms of births to unmarried women, the demographic groups most similar to Immigrants from South Central Asia are Immigrants from China (24.7%, a difference of 0.010%), Immigrants from Eastern Asia (25.0%, a difference of 1.5%), Immigrants from Israel (25.1%, a difference of 1.9%), Indian (Asian) (25.3%, a difference of 2.4%), and Iranian (25.3%, a difference of 2.5%).
| Demographics | Rating | Rank | Births to Unmarried Women |
| Immigrants | India | 100.0 /100 | #2 | Exceptional 22.9% |
| Filipinos | 100.0 /100 | #3 | Exceptional 23.0% |
| Immigrants | Taiwan | 100.0 /100 | #4 | Exceptional 23.0% |
| Immigrants | Hong Kong | 100.0 /100 | #5 | Exceptional 23.6% |
| Immigrants | Iran | 100.0 /100 | #6 | Exceptional 24.0% |
| Thais | 100.0 /100 | #7 | Exceptional 24.0% |
| Immigrants | China | 100.0 /100 | #8 | Exceptional 24.7% |
| Immigrants | South Central Asia | 100.0 /100 | #9 | Exceptional 24.7% |
| Immigrants | Eastern Asia | 100.0 /100 | #10 | Exceptional 25.0% |
| Immigrants | Israel | 100.0 /100 | #11 | Exceptional 25.1% |
| Indians (Asian) | 100.0 /100 | #12 | Exceptional 25.3% |
| Iranians | 100.0 /100 | #13 | Exceptional 25.3% |
| Immigrants | Lebanon | 100.0 /100 | #14 | Exceptional 25.3% |
| Immigrants | Singapore | 100.0 /100 | #15 | Exceptional 25.6% |
| Immigrants | Belarus | 100.0 /100 | #16 | Exceptional 25.6% |
Demographics Similar to Scotch-Irish by Births to Unmarried Women
In terms of births to unmarried women, the demographic groups most similar to Scotch-Irish are White/Caucasian (33.3%, a difference of 0.0%), Ecuadorian (33.3%, a difference of 0.050%), Celtic (33.3%, a difference of 0.12%), Hawaiian (33.2%, a difference of 0.14%), and Immigrants from Sudan (33.2%, a difference of 0.17%).
| Demographics | Rating | Rank | Births to Unmarried Women |
| Ute | 14.4 /100 | #203 | Poor 33.0% |
| Immigrants | Africa | 14.3 /100 | #204 | Poor 33.0% |
| German Russians | 13.1 /100 | #205 | Poor 33.1% |
| Uruguayans | 12.8 /100 | #206 | Poor 33.1% |
| Immigrants | Sudan | 11.5 /100 | #207 | Poor 33.2% |
| Hawaiians | 11.3 /100 | #208 | Poor 33.2% |
| Whites/Caucasians | 10.7 /100 | #209 | Poor 33.3% |
| Scotch-Irish | 10.7 /100 | #210 | Poor 33.3% |
| Ecuadorians | 10.5 /100 | #211 | Poor 33.3% |
| Celtics | 10.2 /100 | #212 | Poor 33.3% |
| Immigrants | Costa Rica | 9.5 /100 | #213 | Tragic 33.4% |
| Slovaks | 9.3 /100 | #214 | Tragic 33.4% |
| French | 8.7 /100 | #215 | Tragic 33.4% |
| Nepalese | 7.8 /100 | #216 | Tragic 33.5% |
| Spaniards | 7.0 /100 | #217 | Tragic 33.6% |