Houma vs Crow Births to Unmarried Women
COMPARE
Houma
Crow
Births to Unmarried Women
Births to Unmarried Women Comparison
Houma
Crow
46.6%
BIRTHS TO UNMARRIED WOMEN
0.0/ 100
METRIC RATING
337th/ 347
METRIC RANK
40.4%
BIRTHS TO UNMARRIED WOMEN
0.0/ 100
METRIC RATING
320th/ 347
METRIC RANK
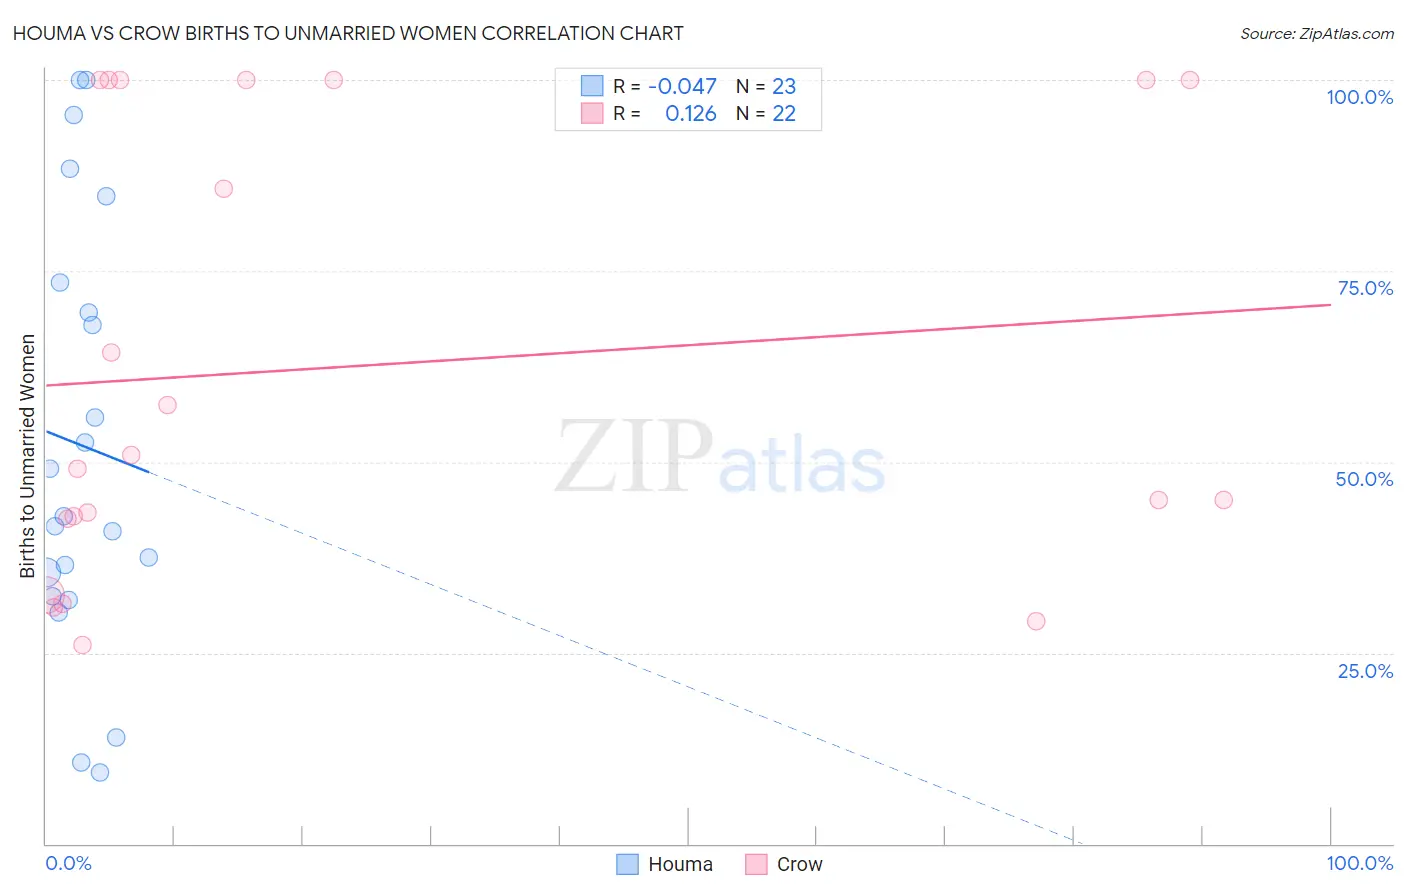
Houma vs Crow Births to Unmarried Women Correlation Chart
The statistical analysis conducted on geographies consisting of 36,513,880 people shows no correlation between the proportion of Houma and percentage of births to unmarried women in the United States with a correlation coefficient (R) of -0.047 and weighted average of 46.6%. Similarly, the statistical analysis conducted on geographies consisting of 58,263,233 people shows a poor positive correlation between the proportion of Crow and percentage of births to unmarried women in the United States with a correlation coefficient (R) of 0.126 and weighted average of 40.4%, a difference of 15.3%.
Births to Unmarried Women Correlation Summary
| Measurement | Houma | Crow |
| Minimum | 9.3% | 26.1% |
| Maximum | 100.0% | 100.0% |
| Range | 90.7% | 73.9% |
| Mean | 52.2% | 62.6% |
| Median | 42.9% | 50.0% |
| Interquartile 25% (IQ1) | 32.4% | 42.5% |
| Interquartile 75% (IQ3) | 73.4% | 100.0% |
| Interquartile Range (IQR) | 41.0% | 57.5% |
| Standard Deviation (Sample) | 28.0% | 29.1% |
| Standard Deviation (Population) | 27.3% | 28.4% |
Demographics Similar to Houma and Crow by Births to Unmarried Women
In terms of births to unmarried women, the demographic groups most similar to Houma are Arapaho (47.1%, a difference of 1.2%), Puerto Rican (45.7%, a difference of 1.9%), Colville (45.3%, a difference of 2.7%), Yuman (44.4%, a difference of 4.9%), and Black/African American (44.3%, a difference of 5.1%). Similarly, the demographic groups most similar to Crow are Yakama (40.3%, a difference of 0.060%), Immigrants from Bahamas (40.1%, a difference of 0.61%), Bahamian (40.8%, a difference of 1.0%), Cajun (41.0%, a difference of 1.5%), and Sioux (41.0%, a difference of 1.6%).
| Demographics | Rating | Rank | Births to Unmarried Women |
| Immigrants | Bahamas | 0.0 /100 | #318 | Tragic 40.1% |
| Yakama | 0.0 /100 | #319 | Tragic 40.3% |
| Crow | 0.0 /100 | #320 | Tragic 40.4% |
| Bahamians | 0.0 /100 | #321 | Tragic 40.8% |
| Cajuns | 0.0 /100 | #322 | Tragic 41.0% |
| Sioux | 0.0 /100 | #323 | Tragic 41.0% |
| Cape Verdeans | 0.0 /100 | #324 | Tragic 41.3% |
| Cheyenne | 0.0 /100 | #325 | Tragic 41.3% |
| Immigrants | Cuba | 0.0 /100 | #326 | Tragic 41.5% |
| Tsimshian | 0.0 /100 | #327 | Tragic 42.2% |
| Immigrants | Cabo Verde | 0.0 /100 | #328 | Tragic 42.2% |
| Paiute | 0.0 /100 | #329 | Tragic 42.5% |
| Chippewa | 0.0 /100 | #330 | Tragic 42.6% |
| Natives/Alaskans | 0.0 /100 | #331 | Tragic 43.0% |
| Kiowa | 0.0 /100 | #332 | Tragic 43.1% |
| Blacks/African Americans | 0.0 /100 | #333 | Tragic 44.3% |
| Yuman | 0.0 /100 | #334 | Tragic 44.4% |
| Colville | 0.0 /100 | #335 | Tragic 45.3% |
| Puerto Ricans | 0.0 /100 | #336 | Tragic 45.7% |
| Houma | 0.0 /100 | #337 | Tragic 46.6% |
| Arapaho | 0.0 /100 | #338 | Tragic 47.1% |