Immigrants from South Africa vs Tohono O'odham Births to Unmarried Women
COMPARE
Immigrants from South Africa
Tohono O'odham
Births to Unmarried Women
Births to Unmarried Women Comparison
Immigrants from South Africa
Tohono O'odham
29.3%
BIRTHS TO UNMARRIED WOMEN
95.7/ 100
METRIC RATING
97th/ 347
METRIC RANK
49.8%
BIRTHS TO UNMARRIED WOMEN
0.0/ 100
METRIC RATING
340th/ 347
METRIC RANK
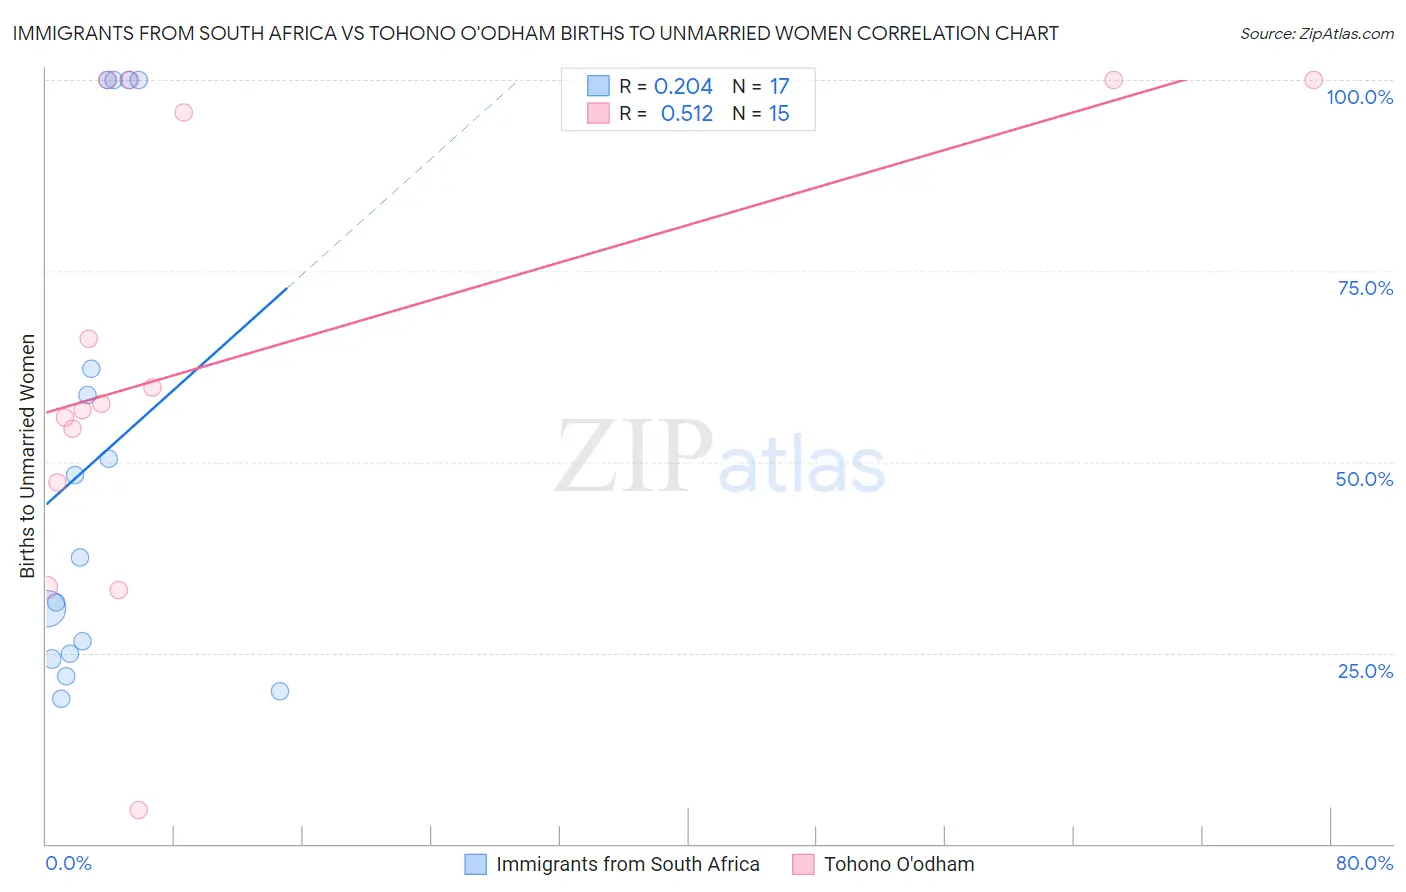
Immigrants from South Africa vs Tohono O'odham Births to Unmarried Women Correlation Chart
The statistical analysis conducted on geographies consisting of 219,322,992 people shows a weak positive correlation between the proportion of Immigrants from South Africa and percentage of births to unmarried women in the United States with a correlation coefficient (R) of 0.204 and weighted average of 29.3%. Similarly, the statistical analysis conducted on geographies consisting of 58,143,081 people shows a substantial positive correlation between the proportion of Tohono O'odham and percentage of births to unmarried women in the United States with a correlation coefficient (R) of 0.512 and weighted average of 49.8%, a difference of 69.8%.
Births to Unmarried Women Correlation Summary
| Measurement | Immigrants from South Africa | Tohono O'odham |
| Minimum | 19.0% | 4.5% |
| Maximum | 100.0% | 100.0% |
| Range | 81.0% | 95.5% |
| Mean | 50.4% | 64.3% |
| Median | 37.5% | 57.6% |
| Interquartile 25% (IQ1) | 24.5% | 47.3% |
| Interquartile 75% (IQ3) | 81.1% | 100.0% |
| Interquartile Range (IQR) | 56.6% | 52.7% |
| Standard Deviation (Sample) | 31.2% | 29.5% |
| Standard Deviation (Population) | 30.3% | 28.5% |
Similar Demographics by Births to Unmarried Women
Demographics Similar to Immigrants from South Africa by Births to Unmarried Women
In terms of births to unmarried women, the demographic groups most similar to Immigrants from South Africa are Immigrants from Syria (29.4%, a difference of 0.020%), Norwegian (29.3%, a difference of 0.040%), Immigrants from Denmark (29.4%, a difference of 0.26%), Luxembourger (29.4%, a difference of 0.26%), and Immigrants from Vietnam (29.3%, a difference of 0.27%).
| Demographics | Rating | Rank | Births to Unmarried Women |
| Immigrants | Latvia | 96.8 /100 | #90 | Exceptional 29.1% |
| Immigrants | Fiji | 96.6 /100 | #91 | Exceptional 29.2% |
| Arabs | 96.5 /100 | #92 | Exceptional 29.2% |
| Estonians | 96.5 /100 | #93 | Exceptional 29.2% |
| Ukrainians | 96.3 /100 | #94 | Exceptional 29.2% |
| Immigrants | Vietnam | 96.1 /100 | #95 | Exceptional 29.3% |
| Norwegians | 95.8 /100 | #96 | Exceptional 29.3% |
| Immigrants | South Africa | 95.7 /100 | #97 | Exceptional 29.3% |
| Immigrants | Syria | 95.7 /100 | #98 | Exceptional 29.4% |
| Immigrants | Denmark | 95.3 /100 | #99 | Exceptional 29.4% |
| Luxembourgers | 95.2 /100 | #100 | Exceptional 29.4% |
| Immigrants | Northern Africa | 94.7 /100 | #101 | Exceptional 29.5% |
| Australians | 94.6 /100 | #102 | Exceptional 29.5% |
| Lebanese | 94.4 /100 | #103 | Exceptional 29.5% |
| Lithuanians | 94.4 /100 | #104 | Exceptional 29.6% |
Demographics Similar to Tohono O'odham by Births to Unmarried Women
In terms of births to unmarried women, the demographic groups most similar to Tohono O'odham are Hopi (50.8%, a difference of 1.9%), Menominee (51.1%, a difference of 2.5%), Pima (51.5%, a difference of 3.3%), Navajo (51.5%, a difference of 3.3%), and Lumbee (48.2%, a difference of 3.4%).
| Demographics | Rating | Rank | Births to Unmarried Women |
| Blacks/African Americans | 0.0 /100 | #333 | Tragic 44.3% |
| Yuman | 0.0 /100 | #334 | Tragic 44.4% |
| Colville | 0.0 /100 | #335 | Tragic 45.3% |
| Puerto Ricans | 0.0 /100 | #336 | Tragic 45.7% |
| Houma | 0.0 /100 | #337 | Tragic 46.6% |
| Arapaho | 0.0 /100 | #338 | Tragic 47.1% |
| Lumbee | 0.0 /100 | #339 | Tragic 48.2% |
| Tohono O'odham | 0.0 /100 | #340 | Tragic 49.8% |
| Hopi | 0.0 /100 | #341 | Tragic 50.8% |
| Menominee | 0.0 /100 | #342 | Tragic 51.1% |
| Pima | 0.0 /100 | #343 | Tragic 51.5% |
| Navajo | 0.0 /100 | #344 | Tragic 51.5% |
| Inupiat | 0.0 /100 | #345 | Tragic 52.1% |
| Pueblo | 0.0 /100 | #346 | Tragic 53.7% |
| Yup'ik | 0.0 /100 | #347 | Tragic 56.4% |