Hawaiian vs Tohono O'odham Bachelor's Degree
COMPARE
Hawaiian
Tohono O'odham
Bachelor's Degree
Bachelor's Degree Comparison
Hawaiians
Tohono O'odham
31.6%
BACHELOR'S DEGREE
0.1/ 100
METRIC RATING
279th/ 347
METRIC RANK
24.4%
BACHELOR'S DEGREE
0.0/ 100
METRIC RATING
343rd/ 347
METRIC RANK
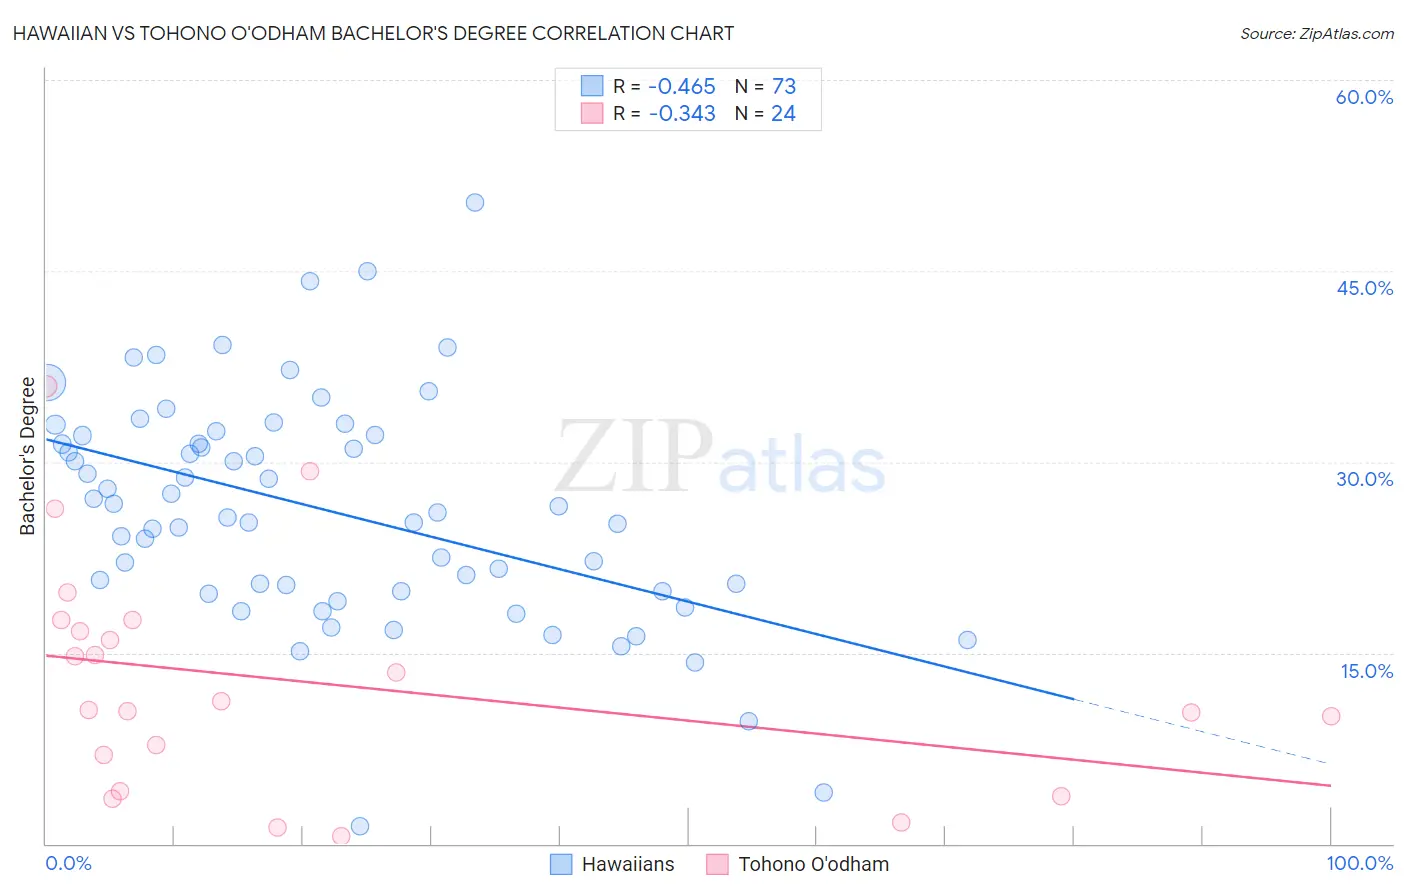
Hawaiian vs Tohono O'odham Bachelor's Degree Correlation Chart
The statistical analysis conducted on geographies consisting of 327,580,632 people shows a moderate negative correlation between the proportion of Hawaiians and percentage of population with at least bachelor's degree education in the United States with a correlation coefficient (R) of -0.465 and weighted average of 31.6%. Similarly, the statistical analysis conducted on geographies consisting of 58,724,509 people shows a mild negative correlation between the proportion of Tohono O'odham and percentage of population with at least bachelor's degree education in the United States with a correlation coefficient (R) of -0.343 and weighted average of 24.4%, a difference of 29.5%.
Bachelor's Degree Correlation Summary
| Measurement | Hawaiian | Tohono O'odham |
| Minimum | 1.4% | 0.61% |
| Maximum | 50.4% | 36.0% |
| Range | 49.0% | 35.4% |
| Mean | 26.2% | 12.7% |
| Median | 26.0% | 10.8% |
| Interquartile 25% (IQ1) | 19.8% | 5.5% |
| Interquartile 75% (IQ3) | 32.1% | 17.1% |
| Interquartile Range (IQR) | 12.3% | 11.6% |
| Standard Deviation (Sample) | 8.9% | 9.0% |
| Standard Deviation (Population) | 8.9% | 8.8% |
Similar Demographics by Bachelor's Degree
Demographics Similar to Hawaiians by Bachelor's Degree
In terms of bachelor's degree, the demographic groups most similar to Hawaiians are Immigrants from Laos (31.6%, a difference of 0.050%), Marshallese (31.7%, a difference of 0.35%), Dominican (31.8%, a difference of 0.40%), Blackfeet (31.5%, a difference of 0.51%), and Salvadoran (31.8%, a difference of 0.55%).
| Demographics | Rating | Rank | Bachelor's Degree |
| Comanche | 0.2 /100 | #272 | Tragic 31.9% |
| Americans | 0.2 /100 | #273 | Tragic 31.9% |
| Potawatomi | 0.2 /100 | #274 | Tragic 31.9% |
| Samoans | 0.1 /100 | #275 | Tragic 31.8% |
| Salvadorans | 0.1 /100 | #276 | Tragic 31.8% |
| Dominicans | 0.1 /100 | #277 | Tragic 31.8% |
| Marshallese | 0.1 /100 | #278 | Tragic 31.7% |
| Hawaiians | 0.1 /100 | #279 | Tragic 31.6% |
| Immigrants | Laos | 0.1 /100 | #280 | Tragic 31.6% |
| Blackfeet | 0.1 /100 | #281 | Tragic 31.5% |
| Immigrants | Caribbean | 0.1 /100 | #282 | Tragic 31.4% |
| Hondurans | 0.1 /100 | #283 | Tragic 31.3% |
| Haitians | 0.1 /100 | #284 | Tragic 31.3% |
| Aleuts | 0.1 /100 | #285 | Tragic 31.3% |
| Immigrants | El Salvador | 0.1 /100 | #286 | Tragic 31.3% |
Demographics Similar to Tohono O'odham by Bachelor's Degree
In terms of bachelor's degree, the demographic groups most similar to Tohono O'odham are Yakama (24.5%, a difference of 0.20%), Yuman (24.5%, a difference of 0.47%), Lumbee (24.8%, a difference of 1.4%), Navajo (23.6%, a difference of 3.4%), and Hopi (25.3%, a difference of 3.6%).
| Demographics | Rating | Rank | Bachelor's Degree |
| Mexicans | 0.0 /100 | #333 | Tragic 27.1% |
| Arapaho | 0.0 /100 | #334 | Tragic 26.6% |
| Natives/Alaskans | 0.0 /100 | #335 | Tragic 26.3% |
| Immigrants | Mexico | 0.0 /100 | #336 | Tragic 26.1% |
| Inupiat | 0.0 /100 | #337 | Tragic 25.8% |
| Pueblo | 0.0 /100 | #338 | Tragic 25.5% |
| Hopi | 0.0 /100 | #339 | Tragic 25.3% |
| Lumbee | 0.0 /100 | #340 | Tragic 24.8% |
| Yuman | 0.0 /100 | #341 | Tragic 24.5% |
| Yakama | 0.0 /100 | #342 | Tragic 24.5% |
| Tohono O'odham | 0.0 /100 | #343 | Tragic 24.4% |
| Navajo | 0.0 /100 | #344 | Tragic 23.6% |
| Pima | 0.0 /100 | #345 | Tragic 23.2% |
| Houma | 0.0 /100 | #346 | Tragic 21.4% |
| Yup'ik | 0.0 /100 | #347 | Tragic 19.4% |