Brazilian vs Immigrants from Croatia Family Households with Children

COMPARE

Brazilian
Race
Ancestry
AfghanAfricanAlaska NativeAlaskan AthabascanAlbanianAleutAlsatianAmericanApacheArabArapahoArgentineanArmenianAssyrian/Chaldean/SyriacAustralianAustrianBahamianBangladeshiBarbadianBasqueBelgianBelizeanBermudanBhutaneseBlackfeetBolivianBrazilianBritishBritish West IndianBulgarianBurmeseCajunCambodianCanadianCape VerdeanCarpatho RusynCelticCentral AmericanCentral American IndianCherokeeCheyenneChickasawChileanChineseChippewaChoctawColombianColvilleComancheCosta RicanCreeCreekCroatianCrowCubanCypriotCzechCzechoslovakianDanishDelawareDominicanDutchDutch West IndianEastern EuropeanEcuadorianEgyptianEnglishEstonianEthiopianEuropeanFijianFilipinoFinnishFrenchFrench American IndianFrench CanadianGermanGerman RussianGhanaianGreekGuamanian/ChamorroGuatemalanGuyaneseHaitianHmongHonduranHopiHoumaHungarianIcelanderIndian (Asian)IndonesianInupiatIranianIraqiIrishIroquoisIsraeliItalianJamaicanJapaneseJordanianKenyanKiowaKoreanLaotianLatvianLebaneseLiberianLithuanianLumbeeLuxembourgerMacedonianMalaysianMalteseMarshalleseMenomineeMexicanMexican American IndianMongolianMoroccanNative HawaiianNavajoNepaleseNew ZealanderNicaraguanNigerianNorthern EuropeanNorwegianOkinawanOsageOttawaPaiutePakistaniPalestinianPanamanianParaguayanPennsylvania GermanPeruvianPimaPolishPortuguesePotawatomiPuebloPuerto RicanPuget Sound SalishRomanianRussianSalvadoranSamoanScandinavianScotch-IrishScottishSeminoleSenegaleseSerbianShoshoneSierra LeoneanSiouxSlavicSlovakSloveneSomaliSouth AfricanSouth AmericanSouth American IndianSoviet UnionSpaniardSpanishSpanish AmericanSpanish American IndianSri LankanSubsaharan AfricanSudaneseSwedishSwissSyrianTaiwaneseThaiTlingit-HaidaTohono O'OdhamTonganTrinidadian and TobagonianTsimshianTurkishU.S. Virgin IslanderUgandanUkrainianUruguayanUteVenezuelanVietnameseWelshWest IndianYakamaYaquiYugoslavianYumanYup'ikZimbabwean
Immigration
NonimmigrantsImmigrantsAfghanistanAfricaAlbaniaArgentinaArmeniaAsiaAustraliaAustriaBahamasBangladeshBarbadosBelarusBelgiumBelizeBoliviaBosnia and HerzegovinaBrazilBulgariaBurma/MyanmarCabo VerdeCambodiaCameroonCanadaCaribbeanCentral AmericaChileChinaColombiaCongoCosta RicaCubaCzechoslovakiaDenmarkDominicaDominican RepublicEastern AfricaEastern AsiaEastern EuropeEcuadorEgyptEl SalvadorEnglandEritreaEthiopiaEuropeFijiFranceGermanyGhanaGreeceGrenadaGuatemalaGuyanaHaitiHondurasHong KongHungaryIndiaIndonesiaIranIraqIrelandIsraelItalyJamaicaJapanJordanKazakhstanKenyaKoreaKuwaitLaosLatin AmericaLatviaLebanonLiberiaLithuaniaMalaysiaMexicoMicronesiaMiddle AfricaMoldovaMoroccoNepalNetherlandsNicaraguaNigeriaNorth AmericaNorth MacedoniaNorthern AfricaNorthern EuropeNorwayOceaniaPakistanPanamaPeruPhilippinesPolandPortugalRomaniaRussiaSaudi ArabiaScotlandSenegalSerbiaSierra LeoneSingaporeSomaliaSouth AfricaSouth AmericaSouth Central AsiaSouth Eastern AsiaSouthern EuropeSpainSri LankaSt. Vincent and the GrenadinesSudanSwedenSwitzerlandSyriaTaiwanThailandTrinidad and TobagoTurkeyUgandaUkraineUruguayUzbekistanVenezuelaVietnamWest IndiesWestern AfricaWestern AsiaWestern EuropeYemenZaireZimbabweAzores
Immigrants from Croatia
Race
Ancestry
AfghanAfricanAlaska NativeAlaskan AthabascanAlbanianAleutAlsatianAmericanApacheArabArapahoArgentineanArmenianAssyrian/Chaldean/SyriacAustralianAustrianBahamianBangladeshiBarbadianBasqueBelgianBelizeanBermudanBhutaneseBlackfeetBolivianBritishBritish West IndianBulgarianBurmeseCajunCambodianCanadianCape VerdeanCarpatho RusynCelticCentral AmericanCentral American IndianCherokeeCheyenneChickasawChileanChineseChippewaChoctawColombianColvilleComancheCosta RicanCreeCreekCroatianCrowCubanCypriotCzechCzechoslovakianDanishDelawareDominicanDutchDutch West IndianEastern EuropeanEcuadorianEgyptianEnglishEstonianEthiopianEuropeanFijianFilipinoFinnishFrenchFrench American IndianFrench CanadianGermanGerman RussianGhanaianGreekGuamanian/ChamorroGuatemalanGuyaneseHaitianHmongHonduranHopiHoumaHungarianIcelanderIndian (Asian)IndonesianInupiatIranianIraqiIrishIroquoisIsraeliItalianJamaicanJapaneseJordanianKenyanKiowaKoreanLaotianLatvianLebaneseLiberianLithuanianLumbeeLuxembourgerMacedonianMalaysianMalteseMarshalleseMenomineeMexicanMexican American IndianMongolianMoroccanNative HawaiianNavajoNepaleseNew ZealanderNicaraguanNigerianNorthern EuropeanNorwegianOkinawanOsageOttawaPaiutePakistaniPalestinianPanamanianParaguayanPennsylvania GermanPeruvianPimaPolishPortuguesePotawatomiPuebloPuerto RicanPuget Sound SalishRomanianRussianSalvadoranSamoanScandinavianScotch-IrishScottishSeminoleSenegaleseSerbianShoshoneSierra LeoneanSiouxSlavicSlovakSloveneSomaliSouth AfricanSouth AmericanSouth American IndianSoviet UnionSpaniardSpanishSpanish AmericanSpanish American IndianSri LankanSubsaharan AfricanSudaneseSwedishSwissSyrianTaiwaneseThaiTlingit-HaidaTohono O'OdhamTonganTrinidadian and TobagonianTsimshianTurkishU.S. Virgin IslanderUgandanUkrainianUruguayanUteVenezuelanVietnameseWelshWest IndianYakamaYaquiYugoslavianYumanYup'ikZimbabwean
Immigration
NonimmigrantsImmigrantsAfghanistanAfricaAlbaniaArgentinaArmeniaAsiaAustraliaAustriaBahamasBangladeshBarbadosBelarusBelgiumBelizeBoliviaBosnia and HerzegovinaBrazilBulgariaBurma/MyanmarCabo VerdeCambodiaCameroonCanadaCaribbeanCentral AmericaChileChinaColombiaCongoCosta RicaCroatiaCubaCzechoslovakiaDenmarkDominicaDominican RepublicEastern AfricaEastern AsiaEastern EuropeEcuadorEgyptEl SalvadorEnglandEritreaEthiopiaEuropeFijiFranceGermanyGhanaGreeceGrenadaGuatemalaGuyanaHaitiHondurasHong KongHungaryIndiaIndonesiaIranIraqIrelandIsraelItalyJamaicaJapanJordanKazakhstanKenyaKoreaKuwaitLaosLatin AmericaLatviaLebanonLiberiaLithuaniaMalaysiaMexicoMicronesiaMiddle AfricaMoldovaMoroccoNepalNetherlandsNicaraguaNigeriaNorth AmericaNorth MacedoniaNorthern AfricaNorthern EuropeNorwayOceaniaPakistanPanamaPeruPhilippinesPolandPortugalRomaniaRussiaSaudi ArabiaScotlandSenegalSerbiaSierra LeoneSingaporeSomaliaSouth AfricaSouth AmericaSouth Central AsiaSouth Eastern AsiaSouthern EuropeSpainSri LankaSt. Vincent and the GrenadinesSudanSwedenSwitzerlandSyriaTaiwanThailandTrinidad and TobagoTurkeyUgandaUkraineUruguayUzbekistanVenezuelaVietnamWest IndiesWestern AfricaWestern AsiaWestern EuropeYemenZaireZimbabweAzores
Family Households with Children
Income
Poverty
Unemployment
Labor Participation
Family Structure
Vehicle Availability
Education Level
Disability

Family Households with Children Comparison

Brazilians

Immigrants from Croatia

Good
Tragic
27.7%
FAMILY HOUSEHOLDS WITH CHILDREN
79.6/ 100
METRIC RATING
144th/ 347
METRIC RANK
25.7%
FAMILY HOUSEHOLDS WITH CHILDREN
0.0/ 100
METRIC RATING
335th/ 347
METRIC RANK

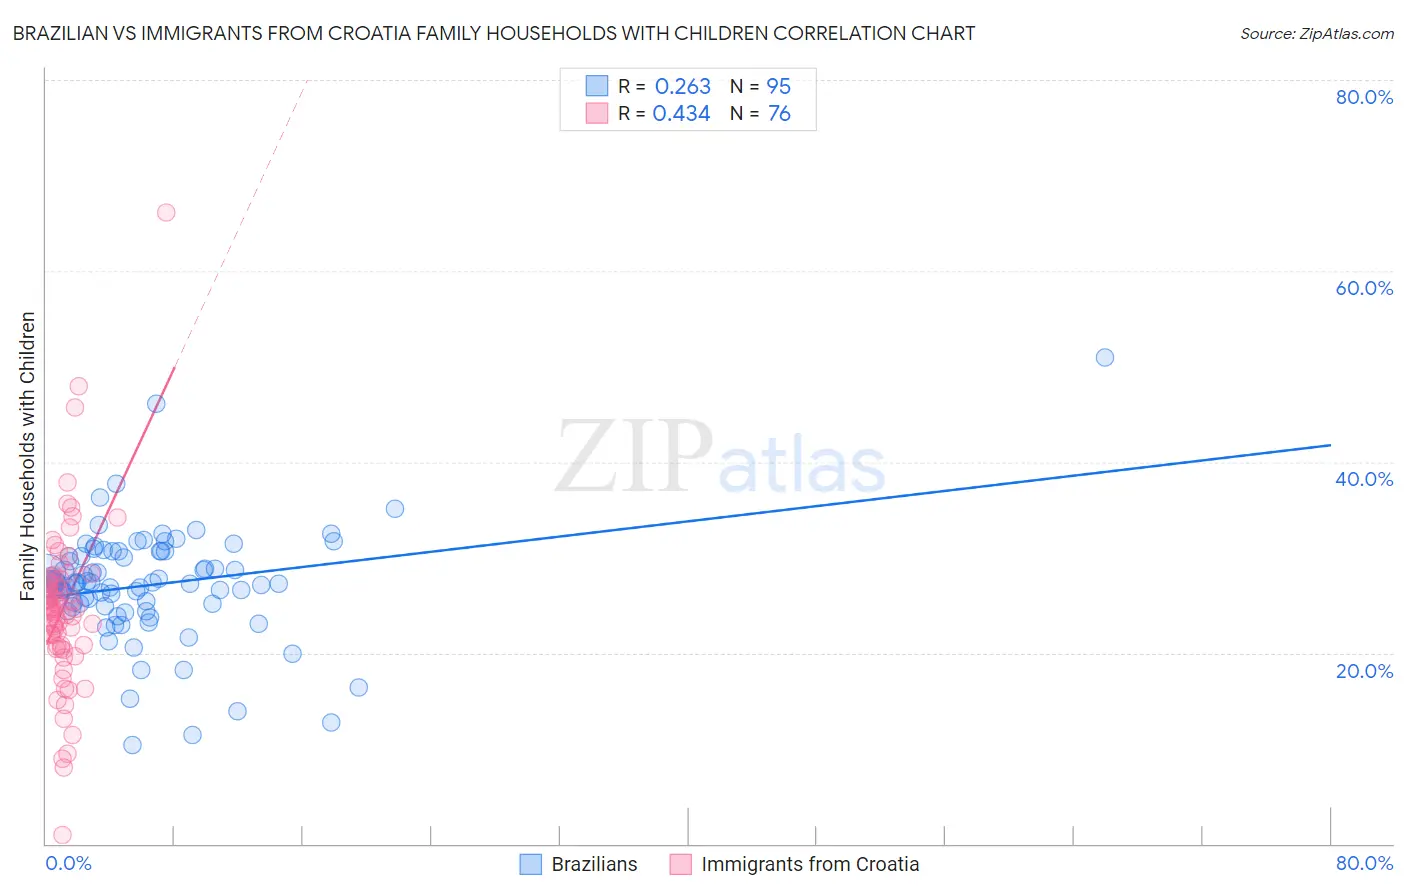
Brazilian vs Immigrants from Croatia Family Households with Children Correlation Chart

The statistical analysis conducted on geographies consisting of 323,614,103 people shows a weak positive correlation between the proportion of Brazilians and percentage of family households with children in the United States with a correlation coefficient (R) of 0.263 and weighted average of 27.7%. Similarly, the statistical analysis conducted on geographies consisting of 132,550,122 people shows a moderate positive correlation between the proportion of Immigrants from Croatia and percentage of family households with children in the United States with a correlation coefficient (R) of 0.434 and weighted average of 25.7%, a difference of 7.6%.
Brazilian vs Immigrants from Croatia Family Households with Children

Family Households with Children Correlation Summary

MeasurementBrazilianImmigrants from Croatia
Minimum10.3%0.93%
Maximum50.9%66.1%
Range40.6%65.1%
Mean27.1%24.7%
Median27.3%24.6%
Interquartile 25% (IQ1)24.9%20.7%
Interquartile 75% (IQ3)30.6%27.7%
Interquartile Range (IQR)5.7%7.0%
Standard Deviation (Sample)5.9%8.9%
Standard Deviation (Population)5.9%8.9%

Similar Demographics by Family Households with Children

Demographics Similar to Brazilians by Family Households with Children

In terms of family households with children, the demographic groups most similar to Brazilians are Immigrants from Chile (27.7%, a difference of 0.010%), Basque (27.7%, a difference of 0.010%), Immigrants from Eastern Africa (27.7%, a difference of 0.020%), Immigrants from Moldova (27.6%, a difference of 0.020%), and Osage (27.6%, a difference of 0.020%).
DemographicsRating | RankFamily Households with Children
Immigrants | Dominican Republic
83.9
/100
|
#137
Excellent
27.7%
Uruguayans
83.2
/100
|
#138
Excellent
27.7%
Vietnamese
82.6
/100
|
#139
Excellent
27.7%
Spanish
81.8
/100
|
#140
Excellent
27.7%
Immigrants | Eastern Asia
81.7
/100
|
#141
Excellent
27.7%
Swiss
81.4
/100
|
#142
Excellent
27.7%
Immigrants | Eastern Africa
80.2
/100
|
#143
Excellent
27.7%
Brazilians
79.6
/100
|
#144
Good
27.7%
Immigrants | Chile
79.5
/100
|
#145
Good
27.7%
Basques
79.5
/100
|
#146
Good
27.7%
Immigrants | Moldova
79.1
/100
|
#147
Good
27.6%
Osage
79.0
/100
|
#148
Good
27.6%
Menominee
78.9
/100
|
#149
Good
27.6%
Argentineans
78.5
/100
|
#150
Good
27.6%
Portuguese
77.8
/100
|
#151
Good
27.6%

Demographics Similar to Immigrants from Croatia by Family Households with Children

In terms of family households with children, the demographic groups most similar to Immigrants from Croatia are Slovak (25.7%, a difference of 0.010%), Immigrants from West Indies (25.7%, a difference of 0.10%), Immigrants from Switzerland (25.7%, a difference of 0.16%), Immigrants from Austria (25.8%, a difference of 0.24%), and Slovene (25.8%, a difference of 0.47%).
DemographicsRating | RankFamily Households with Children
Immigrants | Albania
0.0
/100
|
#328
Tragic
25.9%
Cypriots
0.0
/100
|
#329
Tragic
25.9%
Immigrants | Latvia
0.0
/100
|
#330
Tragic
25.9%
Slovenes
0.0
/100
|
#331
Tragic
25.8%
Immigrants | Austria
0.0
/100
|
#332
Tragic
25.8%
Immigrants | Switzerland
0.0
/100
|
#333
Tragic
25.7%
Slovaks
0.0
/100
|
#334
Tragic
25.7%
Immigrants | Croatia
0.0
/100
|
#335
Tragic
25.7%
Immigrants | West Indies
0.0
/100
|
#336
Tragic
25.7%
Puerto Ricans
0.0
/100
|
#337
Tragic
25.6%
Arapaho
0.0
/100
|
#338
Tragic
25.6%
Immigrants | St. Vincent and the Grenadines
0.0
/100
|
#339
Tragic
25.6%
Immigrants | Armenia
0.0
/100
|
#340
Tragic
25.6%
Immigrants | Serbia
0.0
/100
|
#341
Tragic
25.5%
Alsatians
0.0
/100
|
#342
Tragic
25.3%