Guamanian/Chamorro vs Immigrants from Croatia Median Family Income
COMPARE
Guamanian/Chamorro
Immigrants from Croatia
Median Family Income
Median Family Income Comparison
Guamanians/Chamorros
Immigrants from Croatia
$101,061
MEDIAN FAMILY INCOME
30.5/ 100
METRIC RATING
188th/ 347
METRIC RANK
$112,323
MEDIAN FAMILY INCOME
99.3/ 100
METRIC RATING
80th/ 347
METRIC RANK
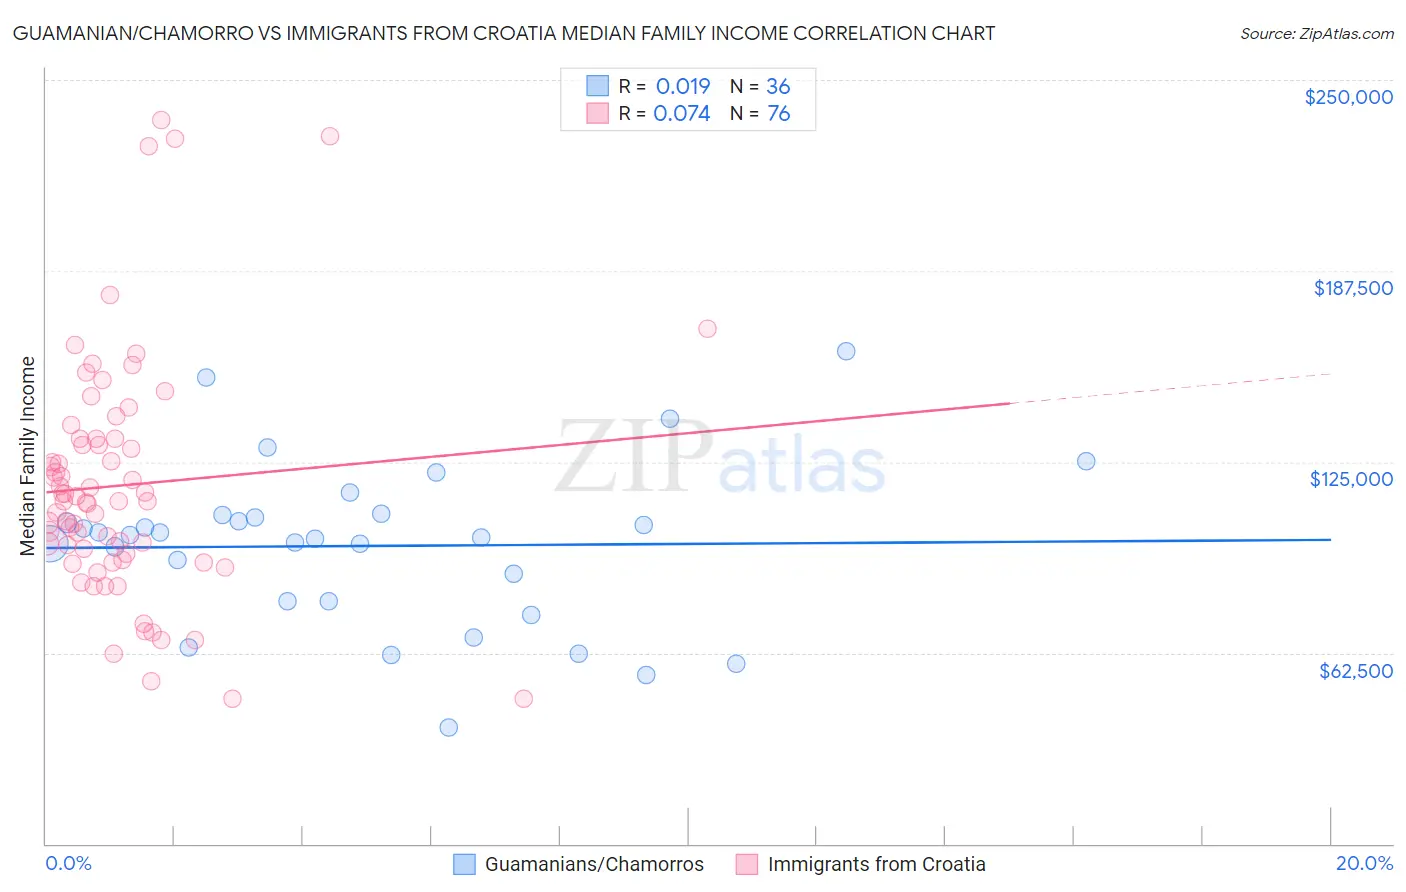
Guamanian/Chamorro vs Immigrants from Croatia Median Family Income Correlation Chart
The statistical analysis conducted on geographies consisting of 221,859,912 people shows no correlation between the proportion of Guamanians/Chamorros and median family income in the United States with a correlation coefficient (R) of 0.019 and weighted average of $101,061. Similarly, the statistical analysis conducted on geographies consisting of 132,566,402 people shows a slight positive correlation between the proportion of Immigrants from Croatia and median family income in the United States with a correlation coefficient (R) of 0.074 and weighted average of $112,323, a difference of 11.1%.
Median Family Income Correlation Summary
| Measurement | Guamanian/Chamorro | Immigrants from Croatia |
| Minimum | $37,991 | $47,321 |
| Maximum | $161,250 | $236,888 |
| Range | $123,259 | $189,567 |
| Mean | $97,460 | $117,325 |
| Median | $100,672 | $112,019 |
| Interquartile 25% (IQ1) | $79,398 | $93,889 |
| Interquartile 75% (IQ3) | $107,355 | $132,485 |
| Interquartile Range (IQR) | $27,957 | $38,596 |
| Standard Deviation (Sample) | $26,595 | $39,118 |
| Standard Deviation (Population) | $26,223 | $38,860 |
Similar Demographics by Median Family Income
Demographics Similar to Guamanians/Chamorros by Median Family Income
In terms of median family income, the demographic groups most similar to Guamanians/Chamorros are Tlingit-Haida ($101,092, a difference of 0.030%), Celtic ($101,139, a difference of 0.080%), Immigrants from Portugal ($100,984, a difference of 0.080%), Immigrants ($100,962, a difference of 0.10%), and Dutch ($101,192, a difference of 0.13%).
| Demographics | Rating | Rank | Median Family Income |
| Spaniards | 36.8 /100 | #181 | Fair $101,617 |
| Tsimshian | 35.9 /100 | #182 | Fair $101,543 |
| Kenyans | 34.5 /100 | #183 | Fair $101,417 |
| Immigrants | Costa Rica | 33.7 /100 | #184 | Fair $101,354 |
| Dutch | 31.9 /100 | #185 | Fair $101,192 |
| Celtics | 31.3 /100 | #186 | Fair $101,139 |
| Tlingit-Haida | 30.8 /100 | #187 | Fair $101,092 |
| Guamanians/Chamorros | 30.5 /100 | #188 | Fair $101,061 |
| Immigrants | Portugal | 29.6 /100 | #189 | Fair $100,984 |
| Immigrants | Immigrants | 29.4 /100 | #190 | Fair $100,962 |
| Colombians | 27.2 /100 | #191 | Fair $100,750 |
| Immigrants | Kenya | 26.5 /100 | #192 | Fair $100,679 |
| Iraqis | 26.3 /100 | #193 | Fair $100,658 |
| Uruguayans | 26.3 /100 | #194 | Fair $100,656 |
| Immigrants | South America | 23.9 /100 | #195 | Fair $100,414 |
Demographics Similar to Immigrants from Croatia by Median Family Income
In terms of median family income, the demographic groups most similar to Immigrants from Croatia are Italian ($112,372, a difference of 0.040%), Immigrants from Canada ($112,374, a difference of 0.050%), Immigrants from North America ($112,151, a difference of 0.15%), Immigrants from Eastern Europe ($112,527, a difference of 0.18%), and Immigrants from England ($112,038, a difference of 0.25%).
| Demographics | Rating | Rank | Median Family Income |
| Laotians | 99.5 /100 | #73 | Exceptional $112,859 |
| Immigrants | Italy | 99.4 /100 | #74 | Exceptional $112,848 |
| Immigrants | Western Europe | 99.4 /100 | #75 | Exceptional $112,688 |
| Argentineans | 99.4 /100 | #76 | Exceptional $112,665 |
| Immigrants | Eastern Europe | 99.4 /100 | #77 | Exceptional $112,527 |
| Immigrants | Canada | 99.3 /100 | #78 | Exceptional $112,374 |
| Italians | 99.3 /100 | #79 | Exceptional $112,372 |
| Immigrants | Croatia | 99.3 /100 | #80 | Exceptional $112,323 |
| Immigrants | North America | 99.2 /100 | #81 | Exceptional $112,151 |
| Immigrants | England | 99.2 /100 | #82 | Exceptional $112,038 |
| Immigrants | Egypt | 99.0 /100 | #83 | Exceptional $111,689 |
| Immigrants | Hungary | 98.8 /100 | #84 | Exceptional $111,378 |
| Croatians | 98.8 /100 | #85 | Exceptional $111,370 |
| Ukrainians | 98.8 /100 | #86 | Exceptional $111,368 |
| Austrians | 98.8 /100 | #87 | Exceptional $111,306 |