Guamanian/Chamorro vs Immigrants from Croatia Doctorate Degree
COMPARE
Guamanian/Chamorro
Immigrants from Croatia
Doctorate Degree
Doctorate Degree Comparison
Guamanians/Chamorros
Immigrants from Croatia
1.6%
DOCTORATE DEGREE
3.3/ 100
METRIC RATING
232nd/ 347
METRIC RANK
2.1%
DOCTORATE DEGREE
96.8/ 100
METRIC RATING
114th/ 347
METRIC RANK
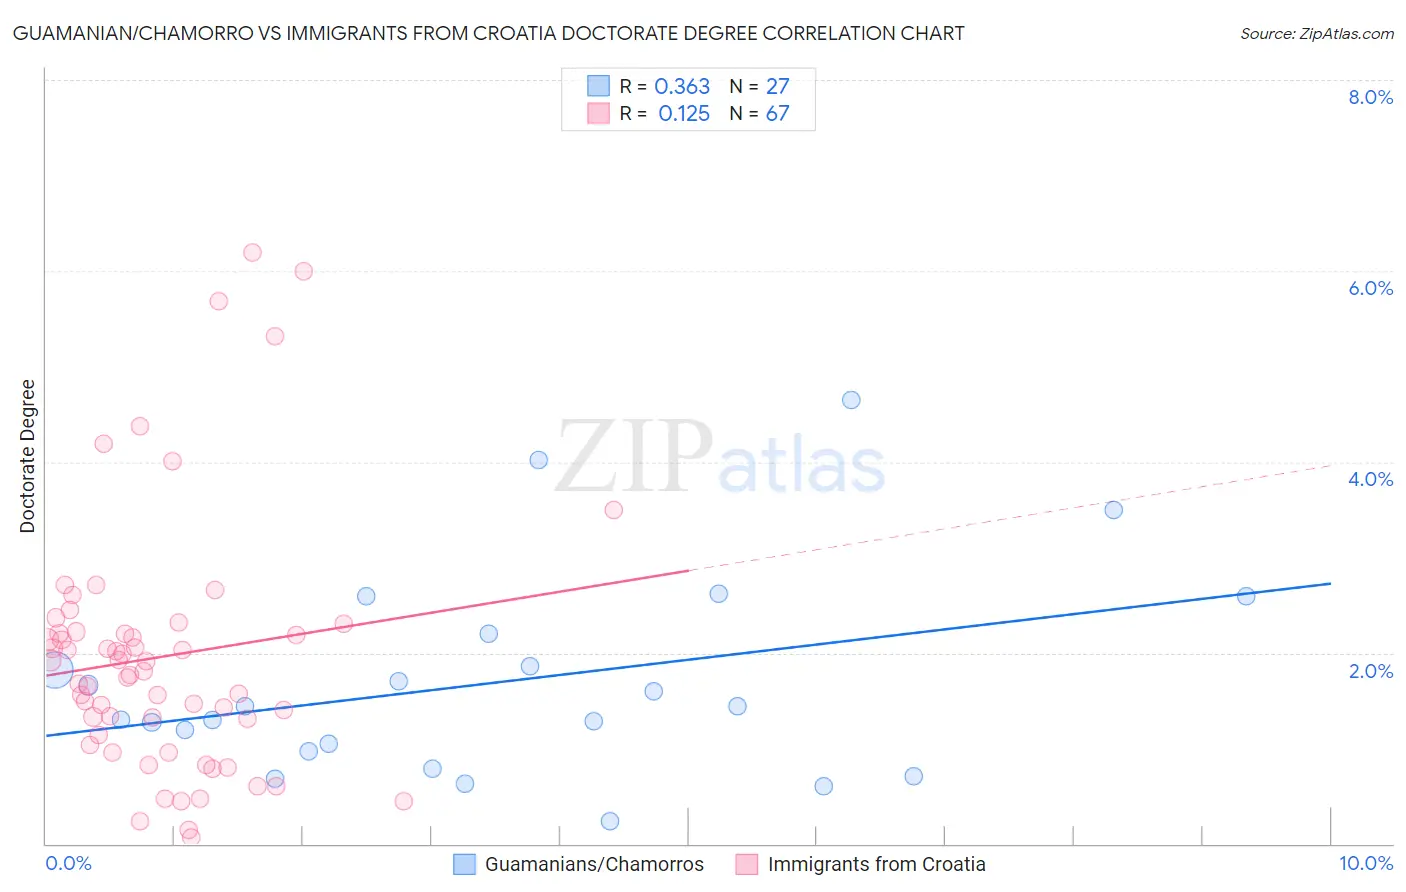
Guamanian/Chamorro vs Immigrants from Croatia Doctorate Degree Correlation Chart
The statistical analysis conducted on geographies consisting of 220,575,272 people shows a mild positive correlation between the proportion of Guamanians/Chamorros and percentage of population with at least doctorate degree education in the United States with a correlation coefficient (R) of 0.363 and weighted average of 1.6%. Similarly, the statistical analysis conducted on geographies consisting of 132,307,639 people shows a poor positive correlation between the proportion of Immigrants from Croatia and percentage of population with at least doctorate degree education in the United States with a correlation coefficient (R) of 0.125 and weighted average of 2.1%, a difference of 28.3%.
Doctorate Degree Correlation Summary
| Measurement | Guamanian/Chamorro | Immigrants from Croatia |
| Minimum | 0.23% | 0.064% |
| Maximum | 4.6% | 6.2% |
| Range | 4.4% | 6.1% |
| Mean | 1.7% | 2.0% |
| Median | 1.4% | 1.8% |
| Interquartile 25% (IQ1) | 0.97% | 1.1% |
| Interquartile 75% (IQ3) | 2.2% | 2.2% |
| Interquartile Range (IQR) | 1.2% | 1.1% |
| Standard Deviation (Sample) | 1.1% | 1.3% |
| Standard Deviation (Population) | 1.0% | 1.3% |
Similar Demographics by Doctorate Degree
Demographics Similar to Guamanians/Chamorros by Doctorate Degree
In terms of doctorate degree, the demographic groups most similar to Guamanians/Chamorros are Barbadian (1.6%, a difference of 0.070%), Hopi (1.6%, a difference of 0.21%), Cree (1.6%, a difference of 0.43%), Immigrants from North Macedonia (1.6%, a difference of 0.69%), and Indonesian (1.6%, a difference of 0.71%).
| Demographics | Rating | Rank | Doctorate Degree |
| Immigrants | Colombia | 6.7 /100 | #225 | Tragic 1.7% |
| Osage | 6.5 /100 | #226 | Tragic 1.7% |
| Panamanians | 6.3 /100 | #227 | Tragic 1.7% |
| Assyrians/Chaldeans/Syriacs | 5.9 /100 | #228 | Tragic 1.7% |
| Colville | 4.7 /100 | #229 | Tragic 1.6% |
| Immigrants | Philippines | 4.3 /100 | #230 | Tragic 1.6% |
| Immigrants | North Macedonia | 3.9 /100 | #231 | Tragic 1.6% |
| Guamanians/Chamorros | 3.3 /100 | #232 | Tragic 1.6% |
| Barbadians | 3.3 /100 | #233 | Tragic 1.6% |
| Hopi | 3.2 /100 | #234 | Tragic 1.6% |
| Cree | 3.0 /100 | #235 | Tragic 1.6% |
| Indonesians | 2.8 /100 | #236 | Tragic 1.6% |
| Iroquois | 2.7 /100 | #237 | Tragic 1.6% |
| Immigrants | Congo | 2.6 /100 | #238 | Tragic 1.6% |
| West Indians | 2.5 /100 | #239 | Tragic 1.6% |
Demographics Similar to Immigrants from Croatia by Doctorate Degree
In terms of doctorate degree, the demographic groups most similar to Immigrants from Croatia are Taiwanese (2.1%, a difference of 0.080%), Immigrants from Italy (2.1%, a difference of 0.15%), Syrian (2.1%, a difference of 0.37%), Immigrants from Pakistan (2.1%, a difference of 0.38%), and Brazilian (2.1%, a difference of 0.44%).
| Demographics | Rating | Rank | Doctorate Degree |
| Europeans | 97.5 /100 | #107 | Exceptional 2.1% |
| Immigrants | Germany | 97.3 /100 | #108 | Exceptional 2.1% |
| Ukrainians | 97.2 /100 | #109 | Exceptional 2.1% |
| Brazilians | 97.2 /100 | #110 | Exceptional 2.1% |
| Immigrants | Pakistan | 97.1 /100 | #111 | Exceptional 2.1% |
| Syrians | 97.1 /100 | #112 | Exceptional 2.1% |
| Immigrants | Italy | 96.9 /100 | #113 | Exceptional 2.1% |
| Immigrants | Croatia | 96.8 /100 | #114 | Exceptional 2.1% |
| Taiwanese | 96.7 /100 | #115 | Exceptional 2.1% |
| Maltese | 96.2 /100 | #116 | Exceptional 2.1% |
| Lebanese | 96.0 /100 | #117 | Exceptional 2.1% |
| Icelanders | 96.0 /100 | #118 | Exceptional 2.1% |
| Pakistanis | 95.8 /100 | #119 | Exceptional 2.0% |
| Immigrants | Morocco | 95.5 /100 | #120 | Exceptional 2.0% |
| Immigrants | Jordan | 94.8 /100 | #121 | Exceptional 2.0% |