Fijian vs Russian Average Family Size
COMPARE
Fijian
Russian
Average Family Size
Average Family Size Comparison
Fijians
Russians
3.36
AVERAGE FAMILY SIZE
100.0/ 100
METRIC RATING
52nd/ 347
METRIC RANK
3.12
AVERAGE FAMILY SIZE
0.1/ 100
METRIC RATING
314th/ 347
METRIC RANK
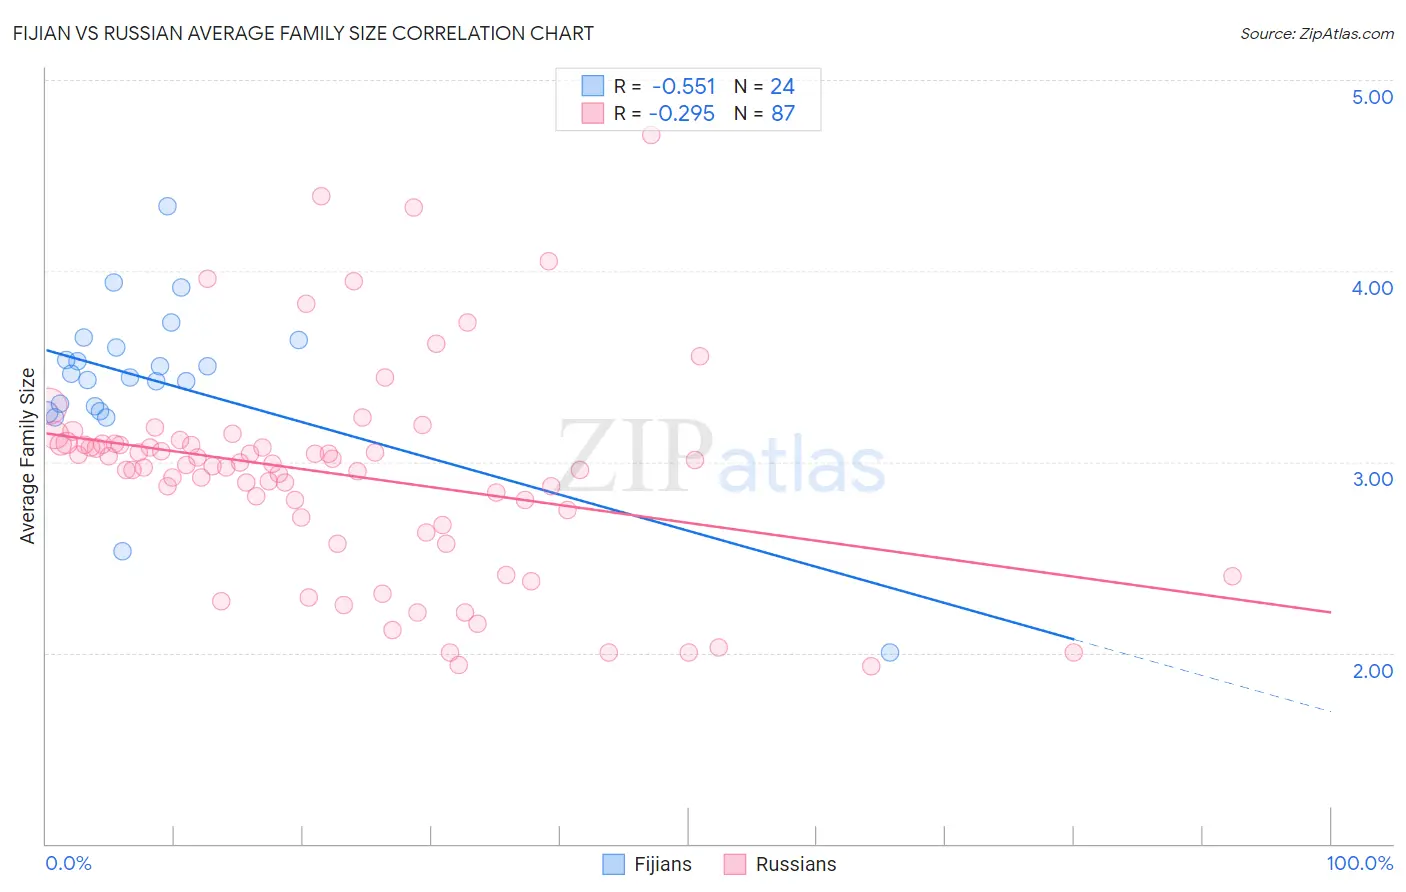
Fijian vs Russian Average Family Size Correlation Chart
The statistical analysis conducted on geographies consisting of 55,947,966 people shows a substantial negative correlation between the proportion of Fijians and average family size in the United States with a correlation coefficient (R) of -0.551 and weighted average of 3.36. Similarly, the statistical analysis conducted on geographies consisting of 511,741,869 people shows a weak negative correlation between the proportion of Russians and average family size in the United States with a correlation coefficient (R) of -0.295 and weighted average of 3.12, a difference of 7.5%.
Average Family Size Correlation Summary
| Measurement | Fijian | Russian |
| Minimum | 2.00 | 1.93 |
| Maximum | 4.34 | 4.71 |
| Range | 2.34 | 2.78 |
| Mean | 3.42 | 2.93 |
| Median | 3.45 | 2.98 |
| Interquartile 25% (IQ1) | 3.28 | 2.67 |
| Interquartile 75% (IQ3) | 3.62 | 3.09 |
| Interquartile Range (IQR) | 0.34 | 0.42 |
| Standard Deviation (Sample) | 0.45 | 0.55 |
| Standard Deviation (Population) | 0.44 | 0.54 |
Similar Demographics by Average Family Size
Demographics Similar to Fijians by Average Family Size
In terms of average family size, the demographic groups most similar to Fijians are Korean (3.36, a difference of 0.030%), Nicaraguan (3.36, a difference of 0.050%), Immigrants from South Eastern Asia (3.36, a difference of 0.050%), Immigrants from Honduras (3.36, a difference of 0.090%), and Immigrants from Bangladesh (3.36, a difference of 0.13%).
| Demographics | Rating | Rank | Average Family Size |
| Shoshone | 100.0 /100 | #45 | Exceptional 3.37 |
| Haitians | 100.0 /100 | #46 | Exceptional 3.37 |
| Vietnamese | 100.0 /100 | #47 | Exceptional 3.37 |
| Immigrants | Nicaragua | 100.0 /100 | #48 | Exceptional 3.37 |
| Bangladeshis | 100.0 /100 | #49 | Exceptional 3.37 |
| Immigrants | Bangladesh | 100.0 /100 | #50 | Exceptional 3.36 |
| Nicaraguans | 100.0 /100 | #51 | Exceptional 3.36 |
| Fijians | 100.0 /100 | #52 | Exceptional 3.36 |
| Koreans | 100.0 /100 | #53 | Exceptional 3.36 |
| Immigrants | South Eastern Asia | 100.0 /100 | #54 | Exceptional 3.36 |
| Immigrants | Honduras | 100.0 /100 | #55 | Exceptional 3.36 |
| Immigrants | Dominican Republic | 100.0 /100 | #56 | Exceptional 3.35 |
| Sri Lankans | 100.0 /100 | #57 | Exceptional 3.35 |
| Hondurans | 100.0 /100 | #58 | Exceptional 3.35 |
| Japanese | 100.0 /100 | #59 | Exceptional 3.35 |
Demographics Similar to Russians by Average Family Size
In terms of average family size, the demographic groups most similar to Russians are Immigrants from Scotland (3.12, a difference of 0.020%), Bulgarian (3.13, a difference of 0.040%), Immigrants from Australia (3.13, a difference of 0.050%), Immigrants from Northern Europe (3.13, a difference of 0.070%), and Czechoslovakian (3.13, a difference of 0.11%).
| Demographics | Rating | Rank | Average Family Size |
| Immigrants | Serbia | 0.1 /100 | #307 | Tragic 3.13 |
| Slavs | 0.1 /100 | #308 | Tragic 3.13 |
| Northern Europeans | 0.1 /100 | #309 | Tragic 3.13 |
| Czechoslovakians | 0.1 /100 | #310 | Tragic 3.13 |
| Immigrants | Northern Europe | 0.1 /100 | #311 | Tragic 3.13 |
| Immigrants | Australia | 0.1 /100 | #312 | Tragic 3.13 |
| Bulgarians | 0.1 /100 | #313 | Tragic 3.13 |
| Russians | 0.1 /100 | #314 | Tragic 3.12 |
| Immigrants | Scotland | 0.1 /100 | #315 | Tragic 3.12 |
| Serbians | 0.1 /100 | #316 | Tragic 3.12 |
| Italians | 0.1 /100 | #317 | Tragic 3.12 |
| Eastern Europeans | 0.1 /100 | #318 | Tragic 3.12 |
| Welsh | 0.1 /100 | #319 | Tragic 3.12 |
| Immigrants | North America | 0.0 /100 | #320 | Tragic 3.12 |
| Immigrants | Austria | 0.0 /100 | #321 | Tragic 3.12 |