Fijian vs Guatemalan Average Family Size
COMPARE
Fijian
Guatemalan
Average Family Size
Average Family Size Comparison
Fijians
Guatemalans
3.36
AVERAGE FAMILY SIZE
100.0/ 100
METRIC RATING
52nd/ 347
METRIC RANK
3.40
AVERAGE FAMILY SIZE
100.0/ 100
METRIC RATING
35th/ 347
METRIC RANK
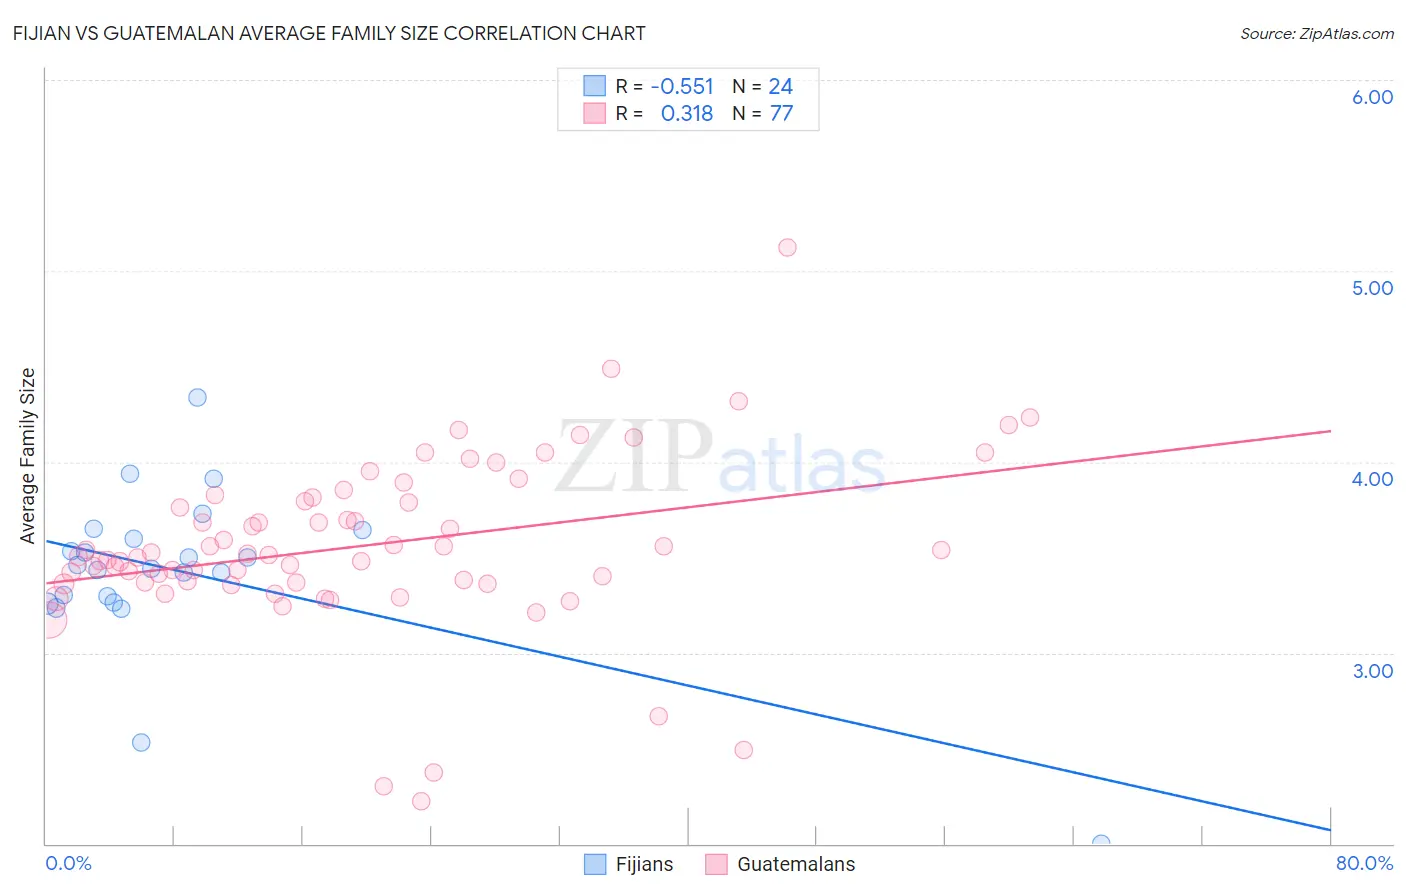
Fijian vs Guatemalan Average Family Size Correlation Chart
The statistical analysis conducted on geographies consisting of 55,947,966 people shows a substantial negative correlation between the proportion of Fijians and average family size in the United States with a correlation coefficient (R) of -0.551 and weighted average of 3.36. Similarly, the statistical analysis conducted on geographies consisting of 409,298,058 people shows a mild positive correlation between the proportion of Guatemalans and average family size in the United States with a correlation coefficient (R) of 0.318 and weighted average of 3.40, a difference of 1.3%.
Average Family Size Correlation Summary
| Measurement | Fijian | Guatemalan |
| Minimum | 2.00 | 2.22 |
| Maximum | 4.34 | 5.12 |
| Range | 2.34 | 2.90 |
| Mean | 3.42 | 3.56 |
| Median | 3.45 | 3.51 |
| Interquartile 25% (IQ1) | 3.28 | 3.37 |
| Interquartile 75% (IQ3) | 3.62 | 3.80 |
| Interquartile Range (IQR) | 0.34 | 0.44 |
| Standard Deviation (Sample) | 0.45 | 0.46 |
| Standard Deviation (Population) | 0.44 | 0.45 |
Demographics Similar to Fijians and Guatemalans by Average Family Size
In terms of average family size, the demographic groups most similar to Fijians are Korean (3.36, a difference of 0.030%), Nicaraguan (3.36, a difference of 0.050%), Immigrants from Bangladesh (3.36, a difference of 0.13%), Bangladeshi (3.37, a difference of 0.26%), and Immigrants from Nicaragua (3.37, a difference of 0.32%). Similarly, the demographic groups most similar to Guatemalans are Immigrants from Guyana (3.40, a difference of 0.050%), Hispanic or Latino (3.41, a difference of 0.060%), Hawaiian (3.41, a difference of 0.12%), Guyanese (3.40, a difference of 0.19%), and Immigrants from Belize (3.39, a difference of 0.35%).
| Demographics | Rating | Rank | Average Family Size |
| Hawaiians | 100.0 /100 | #33 | Exceptional 3.41 |
| Hispanics or Latinos | 100.0 /100 | #34 | Exceptional 3.41 |
| Guatemalans | 100.0 /100 | #35 | Exceptional 3.40 |
| Immigrants | Guyana | 100.0 /100 | #36 | Exceptional 3.40 |
| Guyanese | 100.0 /100 | #37 | Exceptional 3.40 |
| Immigrants | Belize | 100.0 /100 | #38 | Exceptional 3.39 |
| Immigrants | Haiti | 100.0 /100 | #39 | Exceptional 3.39 |
| Belizeans | 100.0 /100 | #40 | Exceptional 3.39 |
| Marshallese | 100.0 /100 | #41 | Exceptional 3.38 |
| Immigrants | Vietnam | 100.0 /100 | #42 | Exceptional 3.38 |
| Immigrants | Philippines | 100.0 /100 | #43 | Exceptional 3.37 |
| Alaska Natives | 100.0 /100 | #44 | Exceptional 3.37 |
| Shoshone | 100.0 /100 | #45 | Exceptional 3.37 |
| Haitians | 100.0 /100 | #46 | Exceptional 3.37 |
| Vietnamese | 100.0 /100 | #47 | Exceptional 3.37 |
| Immigrants | Nicaragua | 100.0 /100 | #48 | Exceptional 3.37 |
| Bangladeshis | 100.0 /100 | #49 | Exceptional 3.37 |
| Immigrants | Bangladesh | 100.0 /100 | #50 | Exceptional 3.36 |
| Nicaraguans | 100.0 /100 | #51 | Exceptional 3.36 |
| Fijians | 100.0 /100 | #52 | Exceptional 3.36 |
| Koreans | 100.0 /100 | #53 | Exceptional 3.36 |