Immigrants from Portugal vs Russian Average Family Size
COMPARE
Immigrants from Portugal
Russian
Average Family Size
Average Family Size Comparison
Immigrants from Portugal
Russians
3.18
AVERAGE FAMILY SIZE
4.2/ 100
METRIC RATING
236th/ 347
METRIC RANK
3.12
AVERAGE FAMILY SIZE
0.1/ 100
METRIC RATING
314th/ 347
METRIC RANK
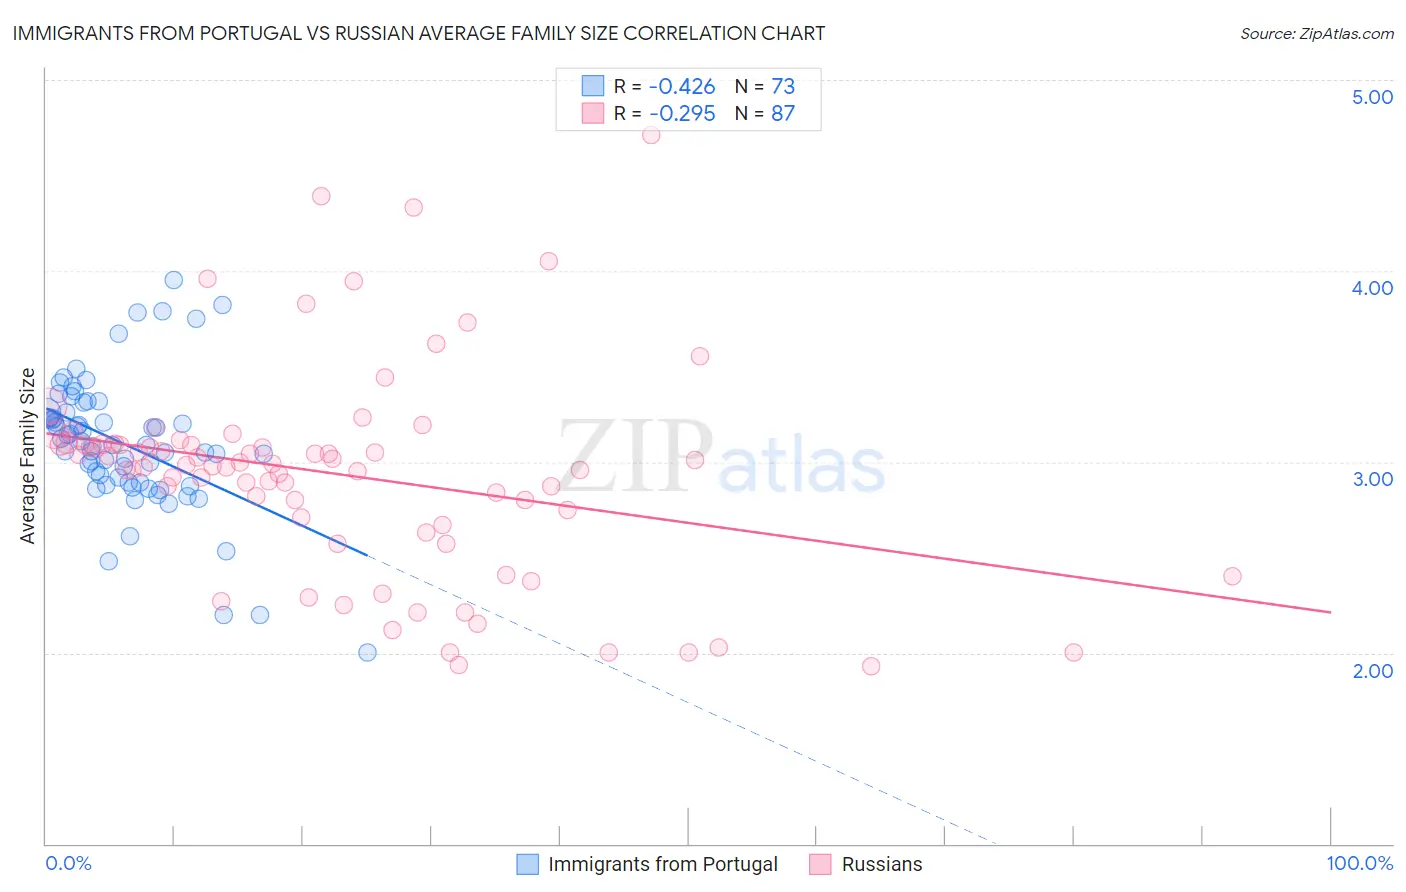
Immigrants from Portugal vs Russian Average Family Size Correlation Chart
The statistical analysis conducted on geographies consisting of 174,766,763 people shows a moderate negative correlation between the proportion of Immigrants from Portugal and average family size in the United States with a correlation coefficient (R) of -0.426 and weighted average of 3.18. Similarly, the statistical analysis conducted on geographies consisting of 511,741,869 people shows a weak negative correlation between the proportion of Russians and average family size in the United States with a correlation coefficient (R) of -0.295 and weighted average of 3.12, a difference of 1.8%.
Average Family Size Correlation Summary
| Measurement | Immigrants from Portugal | Russian |
| Minimum | 2.00 | 1.93 |
| Maximum | 3.95 | 4.71 |
| Range | 1.95 | 2.78 |
| Mean | 3.10 | 2.93 |
| Median | 3.09 | 2.98 |
| Interquartile 25% (IQ1) | 2.89 | 2.67 |
| Interquartile 75% (IQ3) | 3.26 | 3.09 |
| Interquartile Range (IQR) | 0.37 | 0.42 |
| Standard Deviation (Sample) | 0.35 | 0.55 |
| Standard Deviation (Population) | 0.35 | 0.54 |
Similar Demographics by Average Family Size
Demographics Similar to Immigrants from Portugal by Average Family Size
In terms of average family size, the demographic groups most similar to Immigrants from Portugal are Immigrants from Turkey (3.18, a difference of 0.010%), Iranian (3.18, a difference of 0.030%), Brazilian (3.18, a difference of 0.040%), Immigrants from Romania (3.18, a difference of 0.050%), and Romanian (3.18, a difference of 0.050%).
| Demographics | Rating | Rank | Average Family Size |
| Immigrants | Italy | 5.3 /100 | #229 | Tragic 3.19 |
| Icelanders | 5.2 /100 | #230 | Tragic 3.19 |
| Basques | 5.2 /100 | #231 | Tragic 3.19 |
| Cherokee | 4.7 /100 | #232 | Tragic 3.18 |
| Brazilians | 4.5 /100 | #233 | Tragic 3.18 |
| Iranians | 4.5 /100 | #234 | Tragic 3.18 |
| Immigrants | Turkey | 4.2 /100 | #235 | Tragic 3.18 |
| Immigrants | Portugal | 4.2 /100 | #236 | Tragic 3.18 |
| Immigrants | Romania | 3.7 /100 | #237 | Tragic 3.18 |
| Romanians | 3.7 /100 | #238 | Tragic 3.18 |
| Houma | 3.4 /100 | #239 | Tragic 3.18 |
| Osage | 3.2 /100 | #240 | Tragic 3.18 |
| Immigrants | Japan | 3.0 /100 | #241 | Tragic 3.18 |
| Hungarians | 3.0 /100 | #242 | Tragic 3.18 |
| Immigrants | Moldova | 2.9 /100 | #243 | Tragic 3.18 |
Demographics Similar to Russians by Average Family Size
In terms of average family size, the demographic groups most similar to Russians are Immigrants from Scotland (3.12, a difference of 0.020%), Bulgarian (3.13, a difference of 0.040%), Immigrants from Australia (3.13, a difference of 0.050%), Immigrants from Northern Europe (3.13, a difference of 0.070%), and Czechoslovakian (3.13, a difference of 0.11%).
| Demographics | Rating | Rank | Average Family Size |
| Immigrants | Serbia | 0.1 /100 | #307 | Tragic 3.13 |
| Slavs | 0.1 /100 | #308 | Tragic 3.13 |
| Northern Europeans | 0.1 /100 | #309 | Tragic 3.13 |
| Czechoslovakians | 0.1 /100 | #310 | Tragic 3.13 |
| Immigrants | Northern Europe | 0.1 /100 | #311 | Tragic 3.13 |
| Immigrants | Australia | 0.1 /100 | #312 | Tragic 3.13 |
| Bulgarians | 0.1 /100 | #313 | Tragic 3.13 |
| Russians | 0.1 /100 | #314 | Tragic 3.12 |
| Immigrants | Scotland | 0.1 /100 | #315 | Tragic 3.12 |
| Serbians | 0.1 /100 | #316 | Tragic 3.12 |
| Italians | 0.1 /100 | #317 | Tragic 3.12 |
| Eastern Europeans | 0.1 /100 | #318 | Tragic 3.12 |
| Welsh | 0.1 /100 | #319 | Tragic 3.12 |
| Immigrants | North America | 0.0 /100 | #320 | Tragic 3.12 |
| Immigrants | Austria | 0.0 /100 | #321 | Tragic 3.12 |